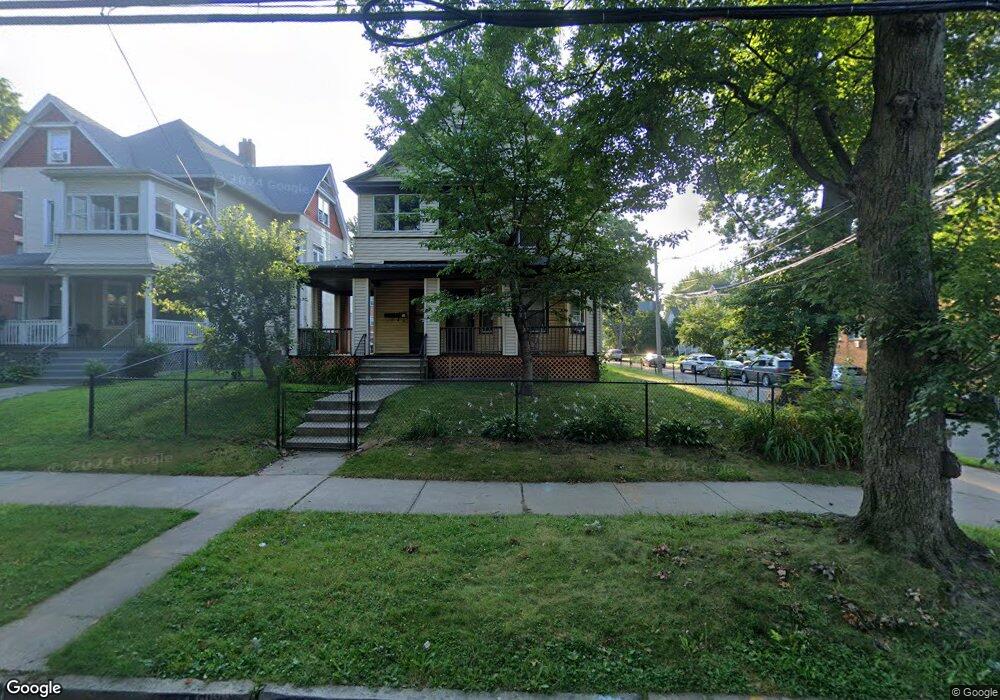
66 Evergreen Ave Unit 68 Hartford, CT 06105
West End NeighborhoodEstimated Value: $346,649 - $550,000
6
Beds
3
Baths
3,068
Sq Ft
$150/Sq Ft
Est. Value
About This Home
This home is located at 66 Evergreen Ave Unit 68, Hartford, CT 06105 and is currently estimated at $460,912, approximately $150 per square foot. 66 Evergreen Ave Unit 68 is a home located in Hartford County with nearby schools including Burns Latino Studies Academy, Sanchez School, and Environmental Sciences Magnet School at Mary Hooker.
Ownership History
Date
Name
Owned For
Owner Type
Purchase Details
Closed on
Apr 16, 2021
Sold by
Nelson Monique and Mcdonald Carlene Y
Bought by
Nelson Monique
Current Estimated Value
Purchase Details
Closed on
Aug 2, 2013
Sold by
Mcdonald Carlene
Bought by
Mcdonald Carlene and Nelson Monique
Purchase Details
Closed on
May 16, 1995
Sold by
Price Leon and Green Deoborah
Bought by
Mcdonald Carlene
Home Financials for this Owner
Home Financials are based on the most recent Mortgage that was taken out on this home.
Original Mortgage
$89,750
Interest Rate
8.31%
Mortgage Type
Purchase Money Mortgage
Purchase Details
Closed on
Jan 5, 1987
Sold by
Chambers Theodore
Bought by
Leon-Price
Home Financials for this Owner
Home Financials are based on the most recent Mortgage that was taken out on this home.
Original Mortgage
$46,000
Interest Rate
9.59%
Mortgage Type
Purchase Money Mortgage
Create a Home Valuation Report for This Property
The Home Valuation Report is an in-depth analysis detailing your home's value as well as a comparison with similar homes in the area
Home Values in the Area
Average Home Value in this Area
Purchase History
| Date | Buyer | Sale Price | Title Company |
|---|---|---|---|
| Nelson Monique | -- | None Available | |
| Mcdonald Carlene | -- | -- | |
| Mcdonald Carlene | $33,000 | -- | |
| Leon-Price | $68,000 | -- |
Source: Public Records
Mortgage History
| Date | Status | Borrower | Loan Amount |
|---|---|---|---|
| Previous Owner | Leon-Price | $132,310 | |
| Previous Owner | Leon-Price | $91,100 | |
| Previous Owner | Leon-Price | $89,750 | |
| Previous Owner | Leon-Price | $46,000 |
Source: Public Records
Tax History Compared to Growth
Tax History
| Year | Tax Paid | Tax Assessment Tax Assessment Total Assessment is a certain percentage of the fair market value that is determined by local assessors to be the total taxable value of land and additions on the property. | Land | Improvement |
|---|---|---|---|---|
| 2025 | $6,641 | $96,322 | $6,872 | $89,450 |
| 2024 | $6,641 | $96,322 | $6,872 | $89,450 |
| 2023 | $6,641 | $96,322 | $6,872 | $89,450 |
| 2022 | $6,641 | $96,322 | $6,872 | $89,450 |
| 2021 | $5,216 | $70,210 | $8,190 | $62,020 |
| 2020 | $5,216 | $70,210 | $8,190 | $62,020 |
| 2019 | $5,216 | $70,210 | $8,190 | $62,020 |
| 2018 | $5,040 | $67,843 | $7,914 | $59,929 |
| 2016 | $5,379 | $72,408 | $18,360 | $54,048 |
| 2015 | $5,124 | $68,969 | $17,488 | $51,481 |
| 2014 | $4,998 | $67,283 | $17,060 | $50,223 |
Source: Public Records
Map
Nearby Homes
- 14 Gray St Unit 16
- 45 Warrenton Ave Unit 47
- 2 Rodney St
- 28 Whitney St
- 40 Owen St Unit B5
- 40 Owen St Unit A3
- 62 Whitney St
- 126 Heath St
- 518 Prospect Ave
- 82 S Whitney St
- 838 Capitol Ave Unit 840
- 478 Prospect Ave
- 102 Rowe Ave
- 90-92 Rowe Ave
- 54 James St Unit 56
- 120 Whitney St
- 39 S Whitney St
- 34 Sisson Ave
- 27 Sisson Ave Unit 29
- 16 Lockwood Terrace
- 62 Evergreen Ave
- 26 Gray St Unit 28
- 33 Gray St
- 78 Evergreen Ave Unit 80
- 63 Evergreen Ave
- 22 Gray St Unit C4
- 47 Evergreen Ave Unit 1
- 47 Evergreen Ave
- 19 Gray St Unit 21
- 82 Evergreen Ave
- 48 Evergreen Ave
- 59 Evergreen Ave
- 84 Evergreen Ave Unit LL-2
- 84 Evergreen Ave Unit 1-4
- 84 Evergreen Ave Unit T-1
- 84 Evergreen Ave
- 84 Evergreen Ave Unit 1-1
- 53 Evergreen Ave
- 77 Evergreen Ave Unit C8