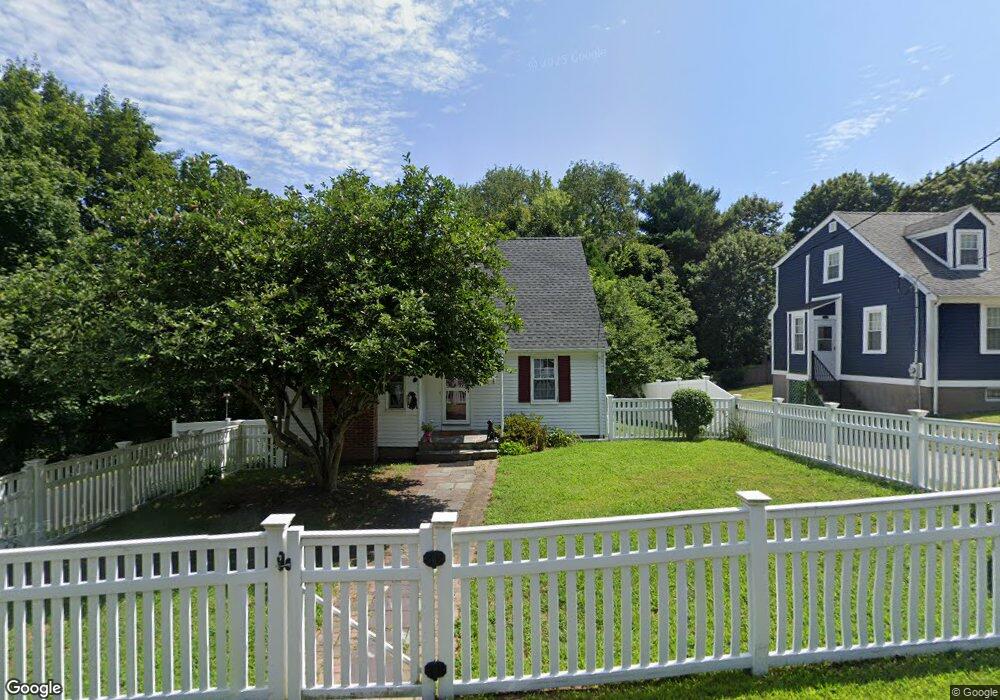
66 Faxon St Braintree, MA 02184
East Braintree NeighborhoodEstimated Value: $621,500 - $675,000
3
Beds
2
Baths
1,329
Sq Ft
$491/Sq Ft
Est. Value
About This Home
This home is located at 66 Faxon St, Braintree, MA 02184 and is currently estimated at $652,625, approximately $491 per square foot. 66 Faxon St is a home located in Norfolk County with nearby schools including Braintree High School, Sacred Heart Elementary School, and South Shore Christian Academy.
Ownership History
Date
Name
Owned For
Owner Type
Purchase Details
Closed on
May 29, 2009
Sold by
Cabral Kim and Cabral Robert J
Bought by
Gough Loriann P
Current Estimated Value
Home Financials for this Owner
Home Financials are based on the most recent Mortgage that was taken out on this home.
Original Mortgage
$232,000
Outstanding Balance
$147,370
Interest Rate
4.87%
Mortgage Type
Purchase Money Mortgage
Estimated Equity
$505,255
Purchase Details
Closed on
Feb 7, 2008
Sold by
Cabral Kim and Healy Kim
Bought by
Cabral Kim and Cabral Robert J
Purchase Details
Closed on
May 21, 1999
Sold by
Johnson Tr Joan A
Bought by
Cabral Robert J
Home Financials for this Owner
Home Financials are based on the most recent Mortgage that was taken out on this home.
Original Mortgage
$151,500
Interest Rate
6.88%
Mortgage Type
Purchase Money Mortgage
Create a Home Valuation Report for This Property
The Home Valuation Report is an in-depth analysis detailing your home's value as well as a comparison with similar homes in the area
Home Values in the Area
Average Home Value in this Area
Purchase History
| Date | Buyer | Sale Price | Title Company |
|---|---|---|---|
| Gough Loriann P | $290,000 | -- | |
| Cabral Kim | -- | -- | |
| Cabral Robert J | $189,900 | -- |
Source: Public Records
Mortgage History
| Date | Status | Borrower | Loan Amount |
|---|---|---|---|
| Open | Gough Loriann P | $232,000 | |
| Previous Owner | Cabral Robert J | $151,500 |
Source: Public Records
Tax History Compared to Growth
Tax History
| Year | Tax Paid | Tax Assessment Tax Assessment Total Assessment is a certain percentage of the fair market value that is determined by local assessors to be the total taxable value of land and additions on the property. | Land | Improvement |
|---|---|---|---|---|
| 2025 | $5,717 | $572,800 | $336,600 | $236,200 |
| 2024 | $5,174 | $545,800 | $313,900 | $231,900 |
| 2023 | $4,896 | $501,600 | $282,000 | $219,600 |
| 2022 | $4,719 | $474,300 | $254,700 | $219,600 |
| 2021 | $4,290 | $431,200 | $230,200 | $201,000 |
| 2020 | $4,045 | $410,200 | $209,200 | $201,000 |
| 2019 | $3,887 | $385,200 | $200,100 | $185,100 |
| 2018 | $3,791 | $359,700 | $182,000 | $177,700 |
| 2017 | $3,686 | $343,200 | $172,900 | $170,300 |
| 2016 | $3,415 | $311,000 | $145,600 | $165,400 |
| 2015 | $3,353 | $302,900 | $143,700 | $159,200 |
| 2014 | $3,174 | $277,900 | $131,000 | $146,900 |
Source: Public Records
Map
Nearby Homes
- 51 Faxon St
- 41 Lantern Ln
- 37 Lantern Ln
- 141 Commercial St Unit 9
- 125 Allen St Unit A
- 124 Louise Rd
- 122 Washington St Unit 22
- 15 Summer St
- 11 Richmond St
- 298 Lisle St
- 74 Magnolia St
- 141 Hobart St
- 159 Hobart St
- 23-25 Lindbergh Ave
- 16 Lindbergh Ave
- 67 Somerville Ave
- 19 Common St
- 312 Shaw St
- 114 Broad St Unit D
- 19 Vine St Unit 3