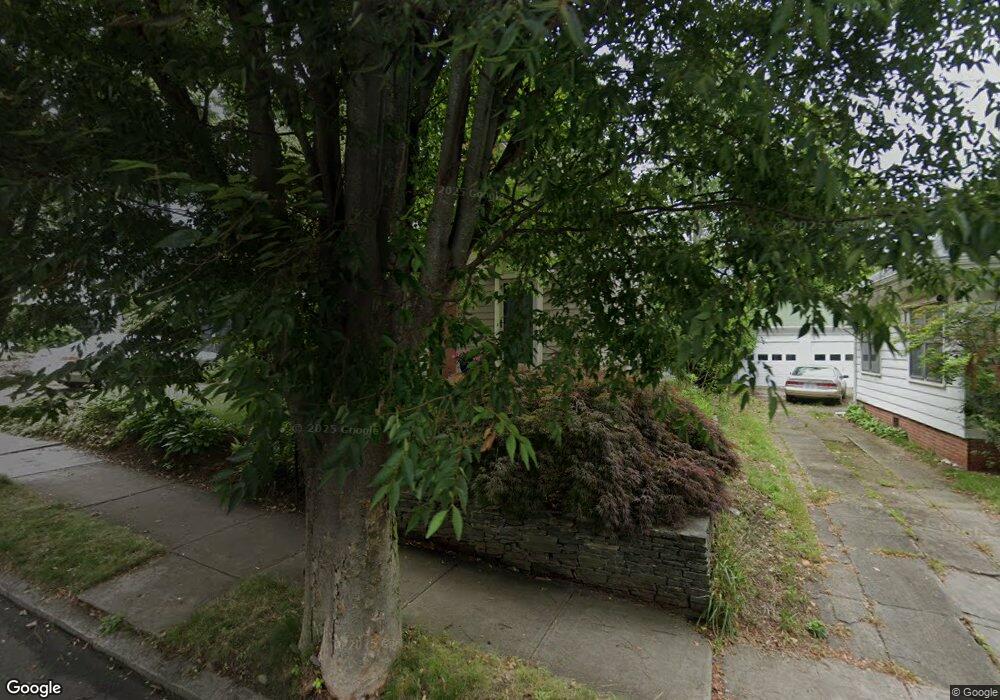
66 Fosdyke St Providence, RI 02906
Blackstone NeighborhoodEstimated Value: $770,000 - $1,019,000
3
Beds
2
Baths
1,778
Sq Ft
$488/Sq Ft
Est. Value
About This Home
This home is located at 66 Fosdyke St, Providence, RI 02906 and is currently estimated at $868,490, approximately $488 per square foot. 66 Fosdyke St is a home located in Providence County with nearby schools including Asa Messer Elementary School, Charles N. Fortes Elementary School, and Veazie Street Elementary School.
Ownership History
Date
Name
Owned For
Owner Type
Purchase Details
Closed on
Oct 16, 2015
Sold by
Roth Shelley E
Bought by
Shelley E Roth T and Roth Shelley E
Current Estimated Value
Purchase Details
Closed on
Sep 4, 2012
Sold by
Winkler Todd E
Bought by
Roth Shelley E
Home Financials for this Owner
Home Financials are based on the most recent Mortgage that was taken out on this home.
Original Mortgage
$284,000
Interest Rate
3.56%
Create a Home Valuation Report for This Property
The Home Valuation Report is an in-depth analysis detailing your home's value as well as a comparison with similar homes in the area
Home Values in the Area
Average Home Value in this Area
Purchase History
| Date | Buyer | Sale Price | Title Company |
|---|---|---|---|
| Shelley E Roth T | -- | -- | |
| Roth Shelley E | $360,000 | -- |
Source: Public Records
Mortgage History
| Date | Status | Borrower | Loan Amount |
|---|---|---|---|
| Previous Owner | Roth Shelley E | $284,000 | |
| Previous Owner | Winkler Todd E | $143,000 | |
| Previous Owner | Winkler Todd E | $50,000 |
Source: Public Records
Tax History Compared to Growth
Tax History
| Year | Tax Paid | Tax Assessment Tax Assessment Total Assessment is a certain percentage of the fair market value that is determined by local assessors to be the total taxable value of land and additions on the property. | Land | Improvement |
|---|---|---|---|---|
| 2024 | $10,291 | $560,800 | $308,600 | $252,200 |
| 2023 | $10,291 | $560,800 | $308,600 | $252,200 |
| 2022 | $9,982 | $560,800 | $308,600 | $252,200 |
| 2021 | $10,770 | $438,500 | $236,300 | $202,200 |
| 2020 | $10,770 | $438,500 | $236,300 | $202,200 |
| 2019 | $10,770 | $438,500 | $236,300 | $202,200 |
| 2018 | $12,532 | $392,100 | $220,700 | $171,400 |
| 2017 | $12,532 | $392,100 | $220,700 | $171,400 |
| 2016 | $12,532 | $392,100 | $220,700 | $171,400 |
| 2015 | $11,837 | $357,600 | $206,000 | $151,600 |
| 2014 | $12,069 | $357,600 | $206,000 | $151,600 |
| 2013 | $12,069 | $357,600 | $206,000 | $151,600 |
Source: Public Records
Map
Nearby Homes
- 509 Morris Ave Unit 3
- 57 Faunce Dr
- 640 Elmgrove Ave
- 5 Barbour Dr
- 436 Blackstone Blvd
- 202 Rochambeau Ave Unit 2
- 114 Lorimer Ave
- 16 Morrison St
- 294 Cole Ave
- 62 Harwich Rd
- 290 Blackstone Blvd
- 873 Hope St
- 871 Hope St Unit 4
- 71 Taft Ave
- 69 Taft Ave
- 767 Elmgrove Ave
- 750 Elmgrove Ave
- 561 Wayland Ave Unit A
- 342 Grotto Ave
- 61 Sessions St
- 60 Fosdyke St
- 72 Fosdyke St
- 56 Fosdyke St
- 61 Fosdyke St
- 329 Rochambeau Ave
- 80 Fosdyke St
- 341 Rochambeau Ave
- 67 Fosdyke St
- 57 Fosdyke St
- 321 Rochambeau Ave
- 351 Rochambeau Ave
- 50 Fosdyke St
- 53 Fosdyke St
- 84 Fosdyke St
- 538 Elmgrove Ave
- 47 Fosdyke St
- 44 Fosdyke St
- 317 Rochambeau Ave
- 338 Rochambeau Ave
- 532 Elmgrove Ave