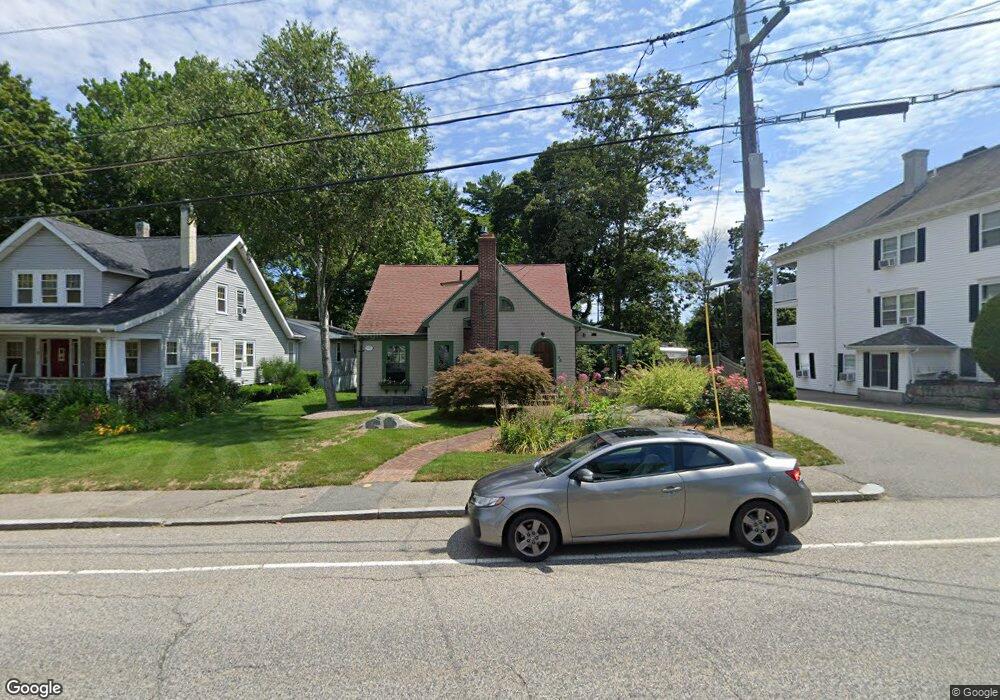
66 Front St Weymouth, MA 02188
Weymouth Landing NeighborhoodEstimated Value: $614,000 - $640,000
3
Beds
2
Baths
1,488
Sq Ft
$423/Sq Ft
Est. Value
About This Home
This home is located at 66 Front St, Weymouth, MA 02188 and is currently estimated at $629,148, approximately $422 per square foot. 66 Front St is a home located in Norfolk County with nearby schools including Frederick C Murphy, Abigail Adams Middle School, and Weymouth Middle School Chapman.
Ownership History
Date
Name
Owned For
Owner Type
Purchase Details
Closed on
Nov 17, 2000
Sold by
Palmer Wayne M and Palmer Catherine M
Bought by
Salvucci Susan M
Current Estimated Value
Home Financials for this Owner
Home Financials are based on the most recent Mortgage that was taken out on this home.
Original Mortgage
$184,000
Interest Rate
7.78%
Mortgage Type
Purchase Money Mortgage
Purchase Details
Closed on
Mar 28, 1997
Sold by
Bower Edward C
Bought by
Palmer Wayne M and Palmer Catherine M
Create a Home Valuation Report for This Property
The Home Valuation Report is an in-depth analysis detailing your home's value as well as a comparison with similar homes in the area
Home Values in the Area
Average Home Value in this Area
Purchase History
| Date | Buyer | Sale Price | Title Company |
|---|---|---|---|
| Salvucci Susan M | $230,000 | -- | |
| Palmer Wayne M | $133,000 | -- |
Source: Public Records
Mortgage History
| Date | Status | Borrower | Loan Amount |
|---|---|---|---|
| Open | Palmer Wayne M | $184,000 | |
| Closed | Palmer Wayne M | $184,000 | |
| Previous Owner | Palmer Wayne M | $130,585 |
Source: Public Records
Tax History Compared to Growth
Tax History
| Year | Tax Paid | Tax Assessment Tax Assessment Total Assessment is a certain percentage of the fair market value that is determined by local assessors to be the total taxable value of land and additions on the property. | Land | Improvement |
|---|---|---|---|---|
| 2025 | $5,435 | $538,100 | $197,300 | $340,800 |
| 2024 | $5,264 | $512,600 | $187,900 | $324,700 |
| 2023 | $5,111 | $489,100 | $174,000 | $315,100 |
| 2022 | $4,964 | $433,200 | $161,100 | $272,100 |
| 2021 | $4,637 | $395,000 | $161,100 | $233,900 |
| 2020 | $4,379 | $367,400 | $161,100 | $206,300 |
| 2019 | $4,122 | $340,100 | $154,900 | $185,200 |
| 2018 | $3,990 | $319,200 | $147,500 | $171,700 |
| 2017 | $3,766 | $294,000 | $140,500 | $153,500 |
| 2016 | $3,620 | $282,800 | $135,100 | $147,700 |
| 2015 | $3,478 | $269,600 | $135,100 | $134,500 |
| 2014 | $3,264 | $245,400 | $125,700 | $119,700 |
Source: Public Records
Map
Nearby Homes
- 122 Washington St Unit 22
- 36 Brookside Rd
- 11 Richmond St
- 15 Summer St
- 23-25 Lindbergh Ave
- 16 Lindbergh Ave
- 37 Lantern Ln
- 114 Broad St Unit D
- 114 Broad St Unit C
- 76 Kingman St
- 141 Commercial St Unit 9
- 19 Vine St Unit 3
- 19 Vine St Unit 1
- 51 Faxon St
- 33 Congress St
- 97 Liberty St
- 685 Union St
- 294 Commercial St
- 48 Apple Tree Ln
- 24 Blake Rd