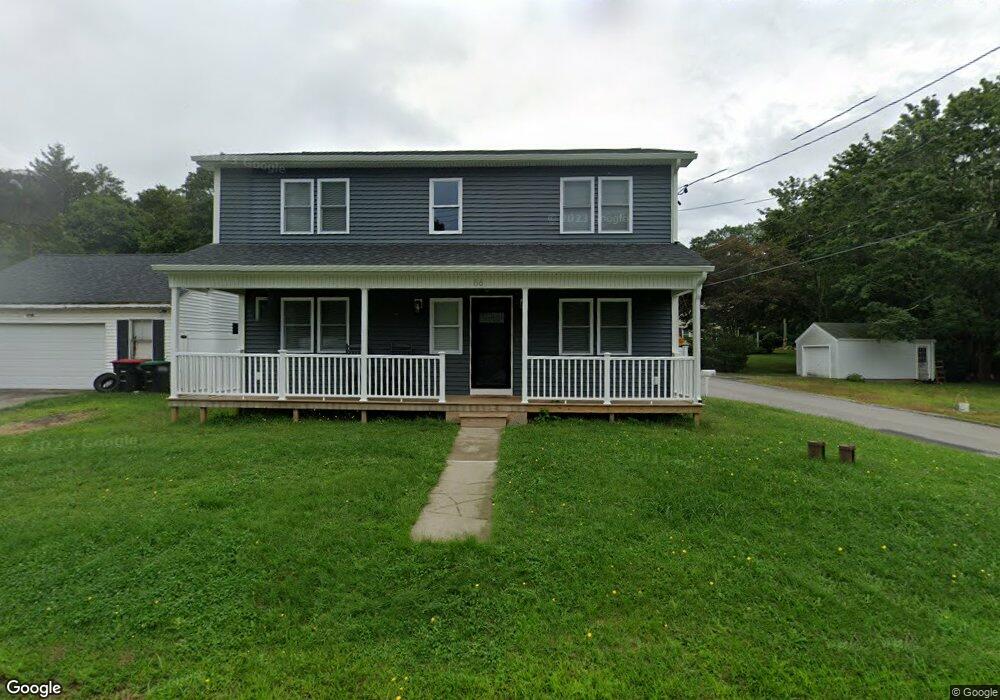
66 Gifford Rd Westport, MA 02790
North Westport NeighborhoodEstimated Value: $441,000 - $535,000
2
Beds
--
Bath
1,632
Sq Ft
$310/Sq Ft
Est. Value
About This Home
This home is located at 66 Gifford Rd, Westport, MA 02790 and is currently estimated at $505,425, approximately $309 per square foot. 66 Gifford Rd is a home located in Bristol County with nearby schools including Alice A. Macomber Primary School, Westport Elementary School, and Westport Middle-High School.
Ownership History
Date
Name
Owned For
Owner Type
Purchase Details
Closed on
Apr 15, 2022
Sold by
Mazzarella Chad S
Bought by
Mazzarella Chad S and Medas Vanessa
Current Estimated Value
Home Financials for this Owner
Home Financials are based on the most recent Mortgage that was taken out on this home.
Original Mortgage
$413,000
Outstanding Balance
$386,394
Interest Rate
3.85%
Mortgage Type
New Conventional
Estimated Equity
$119,031
Purchase Details
Closed on
Dec 3, 2001
Sold by
Charest Azilda
Bought by
Mazzarella Chad S
Home Financials for this Owner
Home Financials are based on the most recent Mortgage that was taken out on this home.
Original Mortgage
$119,700
Interest Rate
6.66%
Mortgage Type
Purchase Money Mortgage
Create a Home Valuation Report for This Property
The Home Valuation Report is an in-depth analysis detailing your home's value as well as a comparison with similar homes in the area
Home Values in the Area
Average Home Value in this Area
Purchase History
| Date | Buyer | Sale Price | Title Company |
|---|---|---|---|
| Mazzarella Chad S | -- | None Available | |
| Mazzarella Chad S | -- | None Available | |
| Mazzarella Chad S | $139,700 | -- | |
| Mazzarella Chad S | $139,700 | -- |
Source: Public Records
Mortgage History
| Date | Status | Borrower | Loan Amount |
|---|---|---|---|
| Open | Mazzarella Chad S | $413,000 | |
| Closed | Mazzarella Chad S | $413,000 | |
| Previous Owner | Mazzarella Chad S | $120,000 | |
| Previous Owner | Mazzarella Chad S | $119,700 |
Source: Public Records
Tax History Compared to Growth
Tax History
| Year | Tax Paid | Tax Assessment Tax Assessment Total Assessment is a certain percentage of the fair market value that is determined by local assessors to be the total taxable value of land and additions on the property. | Land | Improvement |
|---|---|---|---|---|
| 2025 | $3,764 | $505,300 | $164,600 | $340,700 |
| 2024 | $3,706 | $479,400 | $146,100 | $333,300 |
| 2023 | $2,441 | $299,100 | $133,100 | $166,000 |
| 2022 | $2,340 | $276,000 | $133,100 | $142,900 |
| 2021 | $1,833 | $212,700 | $110,000 | $102,700 |
| 2020 | $1,756 | $208,300 | $105,600 | $102,700 |
| 2019 | $1,723 | $208,300 | $105,600 | $102,700 |
| 2018 | $1,587 | $194,200 | $105,900 | $88,300 |
| 2017 | $1,510 | $189,500 | $102,500 | $87,000 |
| 2016 | $1,418 | $179,300 | $99,100 | $80,200 |
| 2015 | $1,384 | $174,500 | $101,400 | $73,100 |
Source: Public Records
Map
Nearby Homes
- 116 Gifford Rd
- 20 Faulkner St
- 9 Kyle Jacob Rd
- 100 D Dr
- 0 Van Buren St
- 15 S Breault St
- 16 S Berryman St
- 3 Diane Way
- 565 Highland Ave
- 9 Register Ave
- 92 Benoit St
- 1276 Old Fall River Rd
- 33 William St
- 771 Sanford Rd
- 6 Beaulieu St
- 25 Beaulieu St
- 27 Dias Ave
- 19 Charles Joseph Dr
- 2 Donna Marie Dr
- 128 Old Bedford Rd