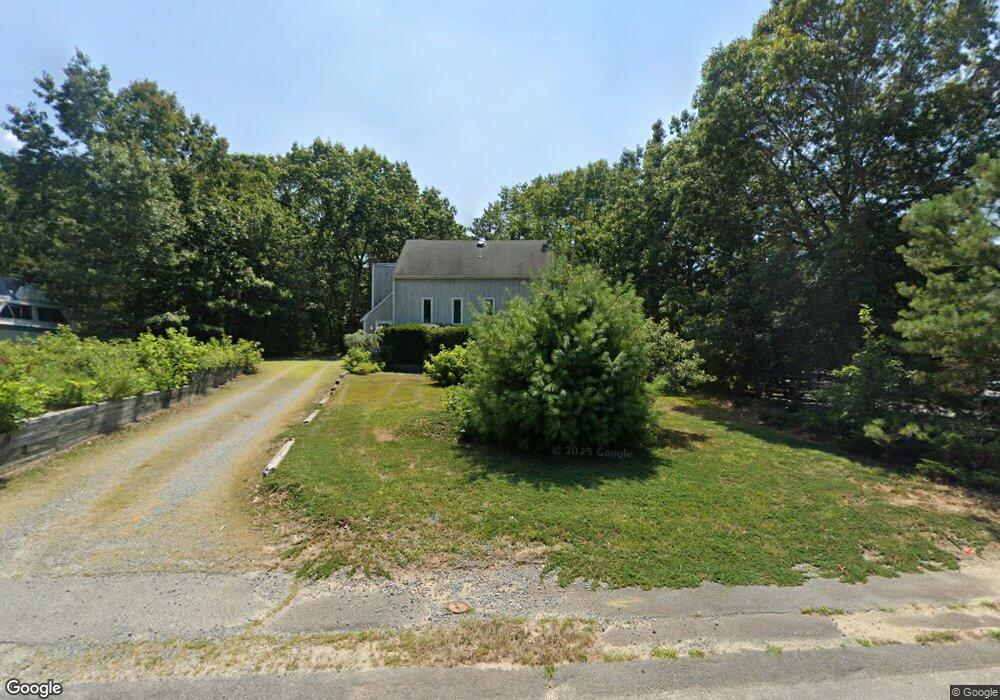
66 Goodwin Rd Plymouth, MA 02360
Estimated Value: $621,000 - $660,000
3
Beds
2
Baths
1,362
Sq Ft
$467/Sq Ft
Est. Value
About This Home
This home is located at 66 Goodwin Rd, Plymouth, MA 02360 and is currently estimated at $635,987, approximately $466 per square foot. 66 Goodwin Rd is a home located in Plymouth County with nearby schools including Federal Furnace Elementary School, Plymouth Community Intermediate, and Plymouth North High School.
Ownership History
Date
Name
Owned For
Owner Type
Purchase Details
Closed on
Jun 5, 2020
Sold by
Keane Brendan P
Bought by
Keane Brendan P and Keane Lisa M
Current Estimated Value
Home Financials for this Owner
Home Financials are based on the most recent Mortgage that was taken out on this home.
Original Mortgage
$224,000
Outstanding Balance
$178,274
Interest Rate
3.2%
Mortgage Type
New Conventional
Estimated Equity
$457,713
Purchase Details
Closed on
Aug 27, 2010
Sold by
Tupper Richard and Kalb Brenda E
Bought by
Keane Brendan P
Home Financials for this Owner
Home Financials are based on the most recent Mortgage that was taken out on this home.
Original Mortgage
$280,000
Interest Rate
4.57%
Mortgage Type
Purchase Money Mortgage
Purchase Details
Closed on
Jul 18, 2008
Sold by
Henen Tupper T and Sb T Division Brist Cn
Bought by
Kalb Brenda E
Create a Home Valuation Report for This Property
The Home Valuation Report is an in-depth analysis detailing your home's value as well as a comparison with similar homes in the area
Home Values in the Area
Average Home Value in this Area
Purchase History
| Date | Buyer | Sale Price | Title Company |
|---|---|---|---|
| Keane Brendan P | -- | None Available | |
| Keane Brendan P | $350,000 | -- | |
| Kalb Brenda E | -- | -- |
Source: Public Records
Mortgage History
| Date | Status | Borrower | Loan Amount |
|---|---|---|---|
| Open | Keane Brendan P | $224,000 | |
| Previous Owner | Keane Brendan P | $280,000 |
Source: Public Records
Tax History Compared to Growth
Tax History
| Year | Tax Paid | Tax Assessment Tax Assessment Total Assessment is a certain percentage of the fair market value that is determined by local assessors to be the total taxable value of land and additions on the property. | Land | Improvement |
|---|---|---|---|---|
| 2025 | $7,133 | $562,100 | $287,800 | $274,300 |
| 2024 | $6,833 | $530,900 | $273,400 | $257,500 |
| 2023 | $6,707 | $489,200 | $249,400 | $239,800 |
| 2022 | $6,598 | $427,600 | $225,100 | $202,500 |
| 2021 | $6,467 | $400,200 | $225,100 | $175,100 |
| 2020 | $6,296 | $385,100 | $213,100 | $172,000 |
| 2019 | $5,870 | $354,900 | $189,100 | $165,800 |
| 2018 | $5,595 | $339,900 | $177,100 | $162,800 |
| 2017 | $5,400 | $325,700 | $177,100 | $148,600 |
| 2016 | $5,203 | $319,800 | $171,100 | $148,700 |
| 2015 | $4,878 | $313,900 | $165,100 | $148,800 |
| 2014 | $4,675 | $309,000 | $165,100 | $143,900 |
Source: Public Records
Map
Nearby Homes