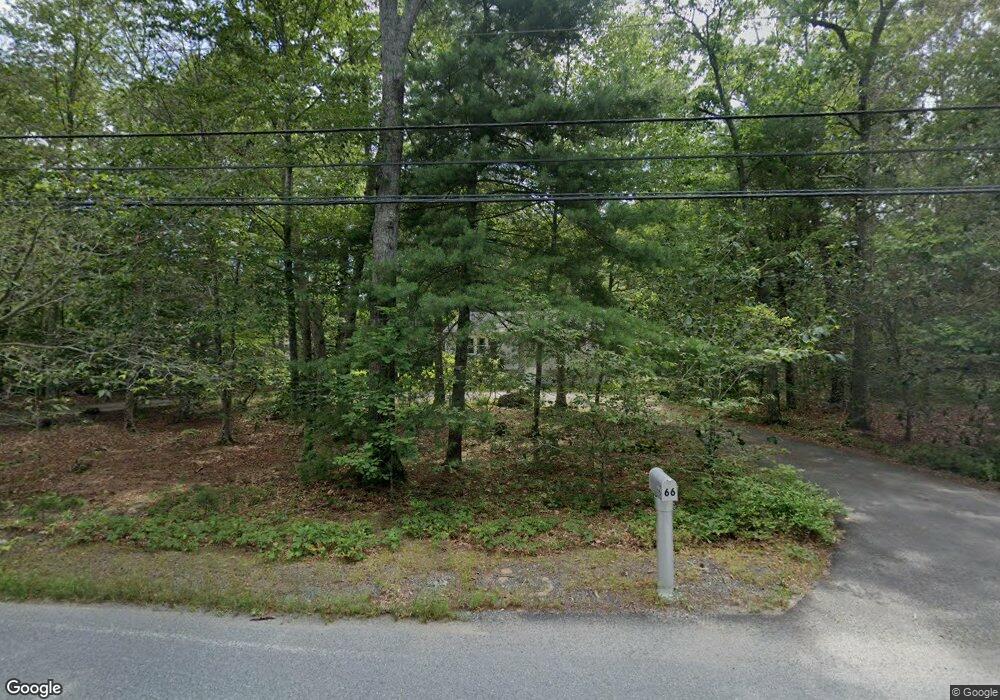
66 Gorham St Rehoboth, MA 02769
Estimated Value: $465,000 - $686,000
2
Beds
2
Baths
1,660
Sq Ft
$337/Sq Ft
Est. Value
About This Home
This home is located at 66 Gorham St, Rehoboth, MA 02769 and is currently estimated at $558,798, approximately $336 per square foot. 66 Gorham St is a home located in Bristol County with nearby schools including Dighton-Rehoboth Regional High School and Cedar Brook School.
Ownership History
Date
Name
Owned For
Owner Type
Purchase Details
Closed on
May 31, 2022
Sold by
Violette Lawrence B
Bought by
Lawrence B Violette Irt
Current Estimated Value
Purchase Details
Closed on
Jul 3, 2006
Sold by
Violette John
Bought by
Goff Neal C and Canito-Goff Berta M
Purchase Details
Closed on
Apr 14, 2006
Sold by
Violette Pamela
Bought by
Canito-Goff Berta M and Goff Neal C
Purchase Details
Closed on
May 18, 2005
Sold by
Violette Sandra and Violette Victoria
Bought by
Goff Neal C and Canito-Goff Berta M
Purchase Details
Closed on
Jan 13, 2005
Sold by
Violette Paul and Townsend Jean
Bought by
Goff Neal C and Canito-Goff Berta M
Create a Home Valuation Report for This Property
The Home Valuation Report is an in-depth analysis detailing your home's value as well as a comparison with similar homes in the area
Home Values in the Area
Average Home Value in this Area
Purchase History
| Date | Buyer | Sale Price | Title Company |
|---|---|---|---|
| Lawrence B Violette Irt | -- | None Available | |
| Goff Neal C | $3,333 | -- | |
| Goff Neal C | $3,333 | -- | |
| Canito-Goff Berta M | $10,000 | -- | |
| Goff Neal C | -- | -- | |
| Goff Neal C | -- | -- |
Source: Public Records
Tax History
| Year | Tax Paid | Tax Assessment Tax Assessment Total Assessment is a certain percentage of the fair market value that is determined by local assessors to be the total taxable value of land and additions on the property. | Land | Improvement |
|---|---|---|---|---|
| 2025 | $43 | $384,300 | $208,900 | $175,400 |
| 2024 | $4,329 | $381,100 | $208,900 | $172,200 |
| 2023 | $4,143 | $357,800 | $204,900 | $152,900 |
| 2022 | $4,032 | $318,200 | $196,500 | $121,700 |
| 2021 | $6,212 | $295,800 | $180,200 | $115,600 |
| 2020 | $3,676 | $280,200 | $180,200 | $100,000 |
| 2018 | $1,249 | $270,300 | $172,400 | $97,900 |
| 2017 | $12,057 | $258,900 | $172,400 | $86,500 |
| 2016 | $3,177 | $261,500 | $172,400 | $89,100 |
| 2015 | $3,052 | $247,900 | $165,200 | $82,700 |
| 2014 | $2,884 | $231,800 | $158,000 | $73,800 |
Source: Public Records
Map
Nearby Homes
Your Personal Tour Guide
Ask me questions while you tour the home.