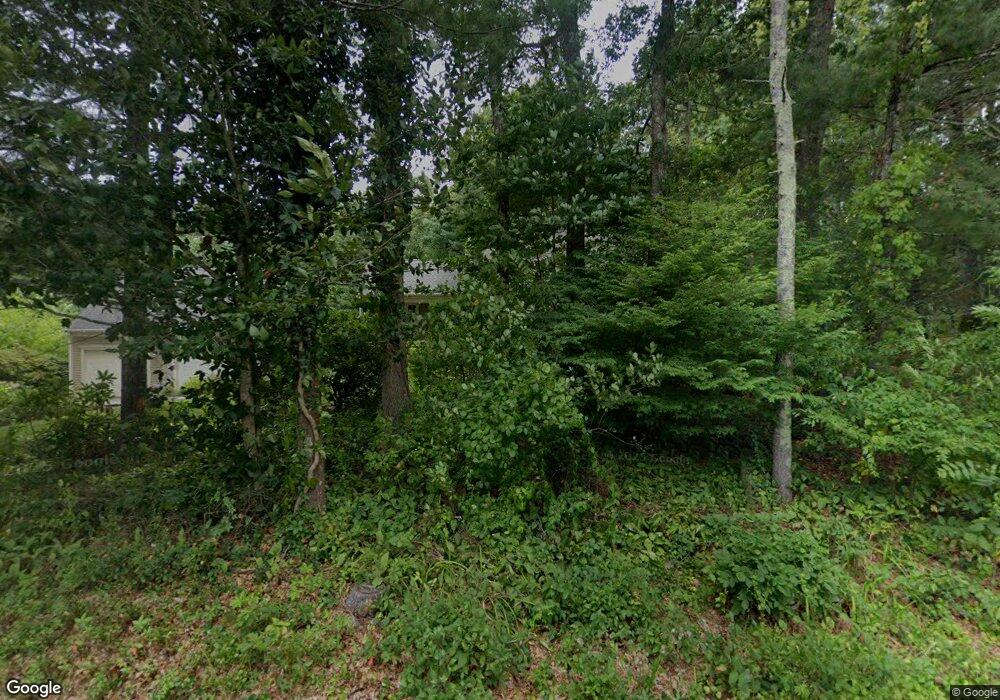
66 Grove St Hanover, MA 02339
Estimated Value: $661,000 - $872,000
3
Beds
2
Baths
1,690
Sq Ft
$442/Sq Ft
Est. Value
About This Home
This home is located at 66 Grove St, Hanover, MA 02339 and is currently estimated at $747,675, approximately $442 per square foot. 66 Grove St is a home located in Plymouth County with nearby schools including Hanover High School, Cadence Academy Preschool - Hanover, and The Master's Academy.
Ownership History
Date
Name
Owned For
Owner Type
Purchase Details
Closed on
Aug 28, 2024
Sold by
Tucker Stephen R and Tucker Marcia L
Bought by
Tucker Ft and Tucker
Current Estimated Value
Create a Home Valuation Report for This Property
The Home Valuation Report is an in-depth analysis detailing your home's value as well as a comparison with similar homes in the area
Home Values in the Area
Average Home Value in this Area
Purchase History
| Date | Buyer | Sale Price | Title Company |
|---|---|---|---|
| Tucker Ft | -- | None Available | |
| Tucker Ft | -- | None Available |
Source: Public Records
Tax History
| Year | Tax Paid | Tax Assessment Tax Assessment Total Assessment is a certain percentage of the fair market value that is determined by local assessors to be the total taxable value of land and additions on the property. | Land | Improvement |
|---|---|---|---|---|
| 2025 | $8,310 | $672,900 | $294,400 | $378,500 |
| 2024 | $8,107 | $631,400 | $294,400 | $337,000 |
| 2023 | $7,869 | $583,300 | $269,100 | $314,200 |
| 2022 | $8,189 | $537,000 | $256,400 | $280,600 |
| 2021 | $2,368 | $481,500 | $211,300 | $270,200 |
| 2020 | $5,586 | $488,500 | $222,900 | $265,600 |
| 2019 | $9,848 | $453,500 | $222,900 | $230,600 |
| 2018 | $5,036 | $448,800 | $222,900 | $225,900 |
| 2017 | $4,044 | $418,700 | $218,300 | $200,400 |
| 2016 | $6,825 | $404,800 | $199,700 | $205,100 |
| 2015 | $6,166 | $381,800 | $186,000 | $195,800 |
Source: Public Records
Map
Nearby Homes
- 36 Grove St
- 250 Center St
- 51 Cervelli Farm Dr
- 37 Dr
- 23 Cervelli Farm Dr
- 38 Cervelli Farm Dr
- 9 Cervelli Farm Dr
- 62 Larchmont Ln
- 95 Tecumseh Dr
- 114 Graham Hill Dr
- 35 Sproul Rd
- 561 Circuit St
- 75 School St
- 70 Bardin St
- 180 Elm St
- 108 Waterford Dr
- 177 Dwelley St
- 44 Stone Meadow Ln
- 47 Stone Meadow Ln
- 430 Brook Bend Rd