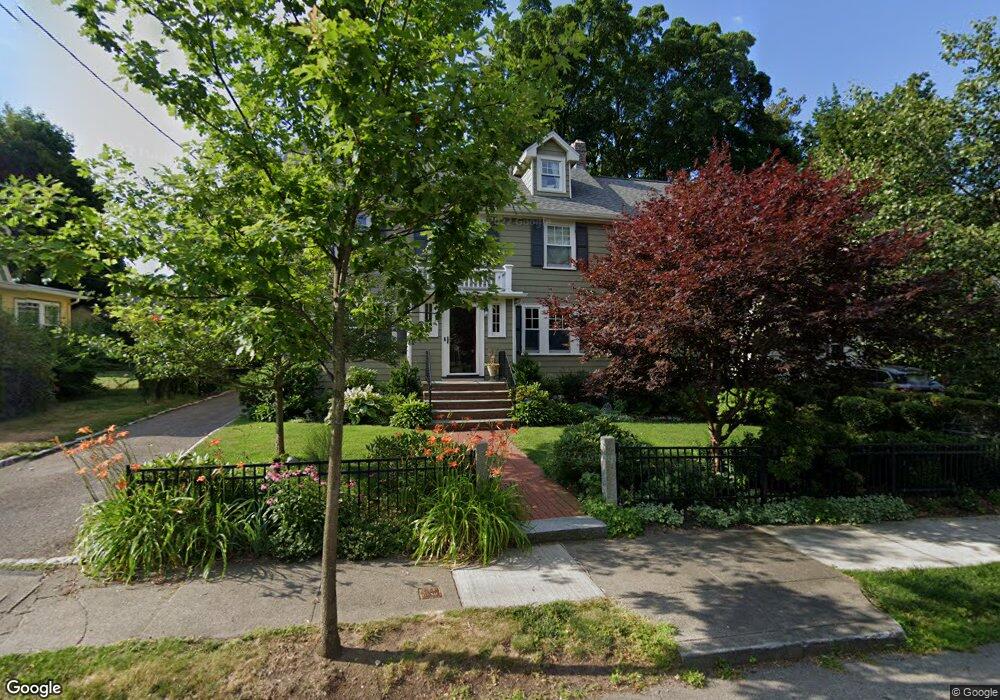
66 Halcyon Rd Newton Center, MA 02459
Thompsonville NeighborhoodEstimated Value: $1,809,000 - $2,386,434
5
Beds
4
Baths
3,384
Sq Ft
$658/Sq Ft
Est. Value
About This Home
This home is located at 66 Halcyon Rd, Newton Center, MA 02459 and is currently estimated at $2,225,859, approximately $657 per square foot. 66 Halcyon Rd is a home located in Middlesex County with nearby schools including Bowen School, Oak Hill Middle School, and Newton South High School.
Ownership History
Date
Name
Owned For
Owner Type
Purchase Details
Closed on
Oct 13, 2016
Sold by
Durbin Chri A and Durbin Portia J
Bought by
Durbin Ret 2016
Current Estimated Value
Purchase Details
Closed on
May 19, 1993
Sold by
Monto Leona M
Bought by
Durbin Chris A and Durbin Portia J
Home Financials for this Owner
Home Financials are based on the most recent Mortgage that was taken out on this home.
Original Mortgage
$272,700
Interest Rate
7.54%
Mortgage Type
Purchase Money Mortgage
Create a Home Valuation Report for This Property
The Home Valuation Report is an in-depth analysis detailing your home's value as well as a comparison with similar homes in the area
Home Values in the Area
Average Home Value in this Area
Purchase History
| Date | Buyer | Sale Price | Title Company |
|---|---|---|---|
| Durbin Ret 2016 | -- | -- | |
| Durbin Chris A | $303,000 | -- |
Source: Public Records
Mortgage History
| Date | Status | Borrower | Loan Amount |
|---|---|---|---|
| Previous Owner | Durbin Chris A | $272,000 | |
| Previous Owner | Durbin Chris A | $272,700 |
Source: Public Records
Tax History Compared to Growth
Tax History
| Year | Tax Paid | Tax Assessment Tax Assessment Total Assessment is a certain percentage of the fair market value that is determined by local assessors to be the total taxable value of land and additions on the property. | Land | Improvement |
|---|---|---|---|---|
| 2025 | $19,106 | $1,949,600 | $1,005,900 | $943,700 |
| 2024 | $17,963 | $1,840,500 | $976,600 | $863,900 |
| 2023 | $17,181 | $1,687,700 | $747,100 | $940,600 |
| 2022 | $16,440 | $1,562,700 | $691,800 | $870,900 |
| 2021 | $6,585 | $1,474,200 | $652,600 | $821,600 |
| 2020 | $15,391 | $1,474,200 | $652,600 | $821,600 |
| 2019 | $14,957 | $1,431,300 | $633,600 | $797,700 |
| 2018 | $14,535 | $1,343,300 | $571,600 | $771,700 |
| 2017 | $14,092 | $1,267,300 | $539,200 | $728,100 |
| 2016 | $13,478 | $1,184,400 | $503,900 | $680,500 |
| 2015 | $12,851 | $1,106,900 | $470,900 | $636,000 |
Source: Public Records
Map
Nearby Homes
- 42 Sunhill Ln
- 671 Boylston St
- 625 Boylston St
- 628 Boylston St
- 5 Halcyon Rd
- 125 Oakdale Rd
- 21 Philbrick Rd
- 1308 Walnut St
- 19 Selwyn Rd
- 1292 Walnut St
- 1597 Centre St Unit 1597
- 1597 Centre St
- 1623-1625 Centre St
- 42 Bow Rd
- 1629 Centre St
- 35 Haynes Rd
- 1151 Walnut St Unit 205
- 1151 Walnut St Unit 405
- 1151 Walnut St Unit 207
- 250 Woodcliff Rd