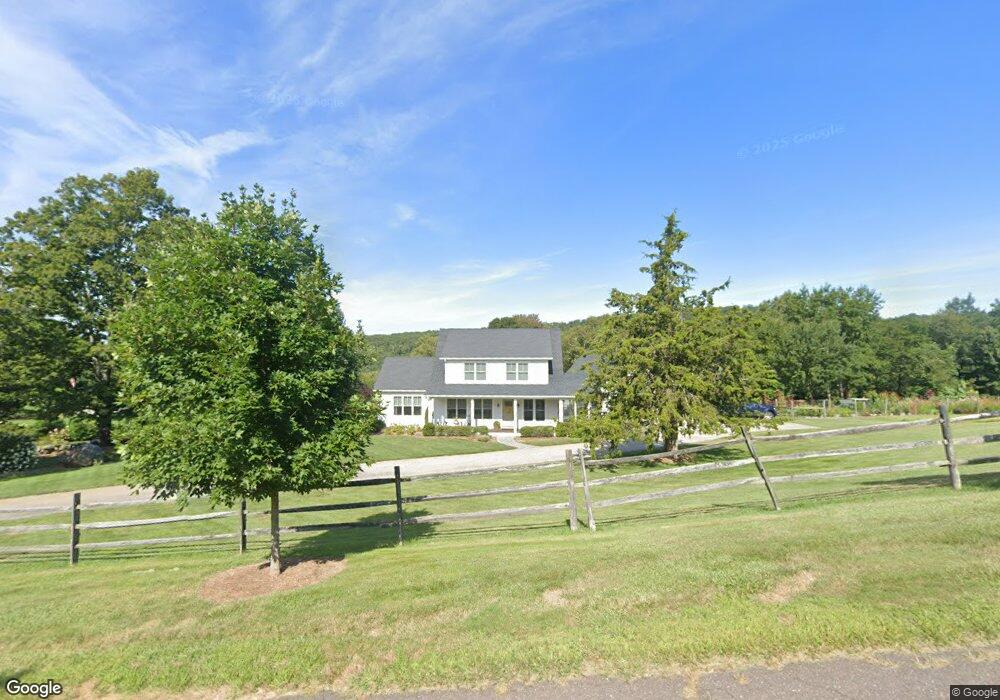
66 Hangdog Ln Somers, CT 06071
Estimated Value: $595,000 - $668,000
3
Beds
3
Baths
2,047
Sq Ft
$317/Sq Ft
Est. Value
About This Home
This home is located at 66 Hangdog Ln, Somers, CT 06071 and is currently estimated at $648,057, approximately $316 per square foot. 66 Hangdog Ln is a home located in Tolland County with nearby schools including Somers Elementary School, Mabelle B. Avery Middle School, and Somers High School.
Ownership History
Date
Name
Owned For
Owner Type
Purchase Details
Closed on
May 9, 2022
Sold by
Barbeau Kevin A
Bought by
Barbeau Kevin A and Barbeau Deirdre M
Current Estimated Value
Purchase Details
Closed on
Sep 24, 2018
Sold by
Barbeau Deirdre M
Bought by
Barbeau Kevin A
Home Financials for this Owner
Home Financials are based on the most recent Mortgage that was taken out on this home.
Original Mortgage
$380,000
Interest Rate
4.5%
Mortgage Type
Credit Line Revolving
Purchase Details
Closed on
Oct 15, 2008
Sold by
Reneris Kimberly
Bought by
Barbeau Deirdre and Barbeau Kevin
Purchase Details
Closed on
Apr 3, 1998
Sold by
Labella Salvatore and Labella Katherine
Bought by
Reneris Kimberly
Purchase Details
Closed on
Aug 21, 1996
Sold by
Dan Roulier & Assoc
Bought by
Labella Salvatore and Labella Katherine
Create a Home Valuation Report for This Property
The Home Valuation Report is an in-depth analysis detailing your home's value as well as a comparison with similar homes in the area
Home Values in the Area
Average Home Value in this Area
Purchase History
| Date | Buyer | Sale Price | Title Company |
|---|---|---|---|
| Barbeau Kevin A | -- | None Available | |
| Barbeau Kevin A | -- | -- | |
| Barbeau Kevin A | -- | -- | |
| Barbeau Deirdre | $350,000 | -- | |
| Barbeau Deirdre | $350,000 | -- | |
| Reneris Kimberly | $125,000 | -- | |
| Reneris Kimberly | $125,000 | -- | |
| Labella Salvatore | $90,000 | -- | |
| Labella Salvatore | $90,000 | -- |
Source: Public Records
Mortgage History
| Date | Status | Borrower | Loan Amount |
|---|---|---|---|
| Previous Owner | Barbeau Kevin A | $380,000 | |
| Previous Owner | Labella Salvatore | $232,500 | |
| Previous Owner | Labella Salvatore | $433,500 |
Source: Public Records
Tax History Compared to Growth
Tax History
| Year | Tax Paid | Tax Assessment Tax Assessment Total Assessment is a certain percentage of the fair market value that is determined by local assessors to be the total taxable value of land and additions on the property. | Land | Improvement |
|---|---|---|---|---|
| 2025 | $9,752 | $322,800 | $127,500 | $195,300 |
| 2024 | $9,348 | $322,800 | $127,500 | $195,300 |
| 2023 | $9,138 | $322,800 | $127,500 | $195,300 |
| 2022 | $8,896 | $322,800 | $127,500 | $195,300 |
| 2021 | $8,606 | $322,800 | $127,500 | $195,300 |
| 2020 | $8,561 | $312,800 | $124,800 | $188,000 |
| 2019 | $5,003 | $182,800 | $134,800 | $48,000 |
| 2018 | $3,689 | $134,800 | $134,800 | $0 |
| 2017 | $3,433 | $134,800 | $134,800 | $0 |
| 2016 | $3,265 | $134,800 | $134,800 | $0 |
| 2015 | $3,316 | $141,900 | $141,900 | $0 |
| 2014 | $3,316 | $141,900 | $141,900 | $0 |
Source: Public Records
Map
Nearby Homes
- 8 S Ridge Rd
- 58 Rocky Dundee Rd
- Lot D South Rd
- 12 & 16 Haas Rd
- Lot 2R &3 Chapin Rd
- 190 Root Rd
- 169 Stafford Rd
- 175 Stafford Rd
- 200 Hampden Rd
- 133 Somers Rd
- 179 Chapin Rd
- 64 Potash Hill Ln
- 41 Martin Farms Rd
- 50 Martin Farms Rd
- 63 Rose Haven Rd
- 23 Hampden Rd
- 49 Stafford Rd
- 319 Main St
- 59 St Germain Rd
- 17 Long Hill Dr