66 Harding Rd Lexington, MA 02420
North Lexington NeighborhoodEstimated Value: $1,269,000 - $1,416,134
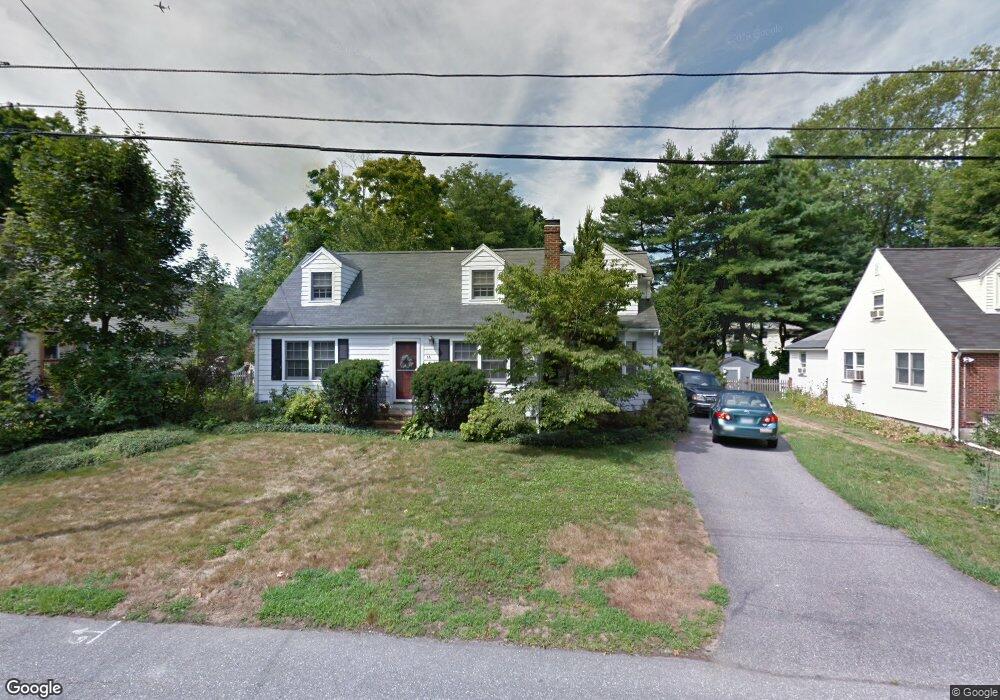
About This Home
This home is located at 66 Harding Rd, Lexington, MA 02420 and is currently estimated at $1,314,284, approximately $644 per square foot. 66 Harding Rd is a home located in Middlesex County with nearby schools including Joseph Estabrook Elementary School, William Diamond Middle School, and Lexington High School.
Ownership History
We collect this data history from publicly available records. To have your information removed, we recommend requesting removal directly through your county’s website.
Purchase Details
Home Values in the Area
Average Home Value in this Area
Purchase History
We collect this data history from publicly available records. To have your information removed, we recommend requesting removal directly through your county’s website.
| Date | Buyer | Sale Price | Title Company |
|---|---|---|---|
| $207,000 | -- |
Mortgage History
We collect this data history from publicly available records. To have your information removed, we recommend requesting removal directly through your county’s website.
| Date | Status | Borrower | Loan Amount |
|---|---|---|---|
| Open | $50,000 | ||
| Open | $162,000 | ||
| Closed | $130,000 | ||
| Closed | $128,000 |
Tax History
We collect this data history from publicly available records. To have your information removed, we recommend requesting removal directly through your county’s website.
| Year | Tax Paid | Tax Assessment Tax Assessment Total Assessment is a certain percentage of the fair market value that is determined by local assessors to be the total taxable value of land and additions on the property. | Land | Improvement |
|---|---|---|---|---|
| 2025 | $13,624 | $1,114,000 | $805,000 | $309,000 |
| 2024 | $13,157 | $1,074,000 | $767,000 | $307,000 |
| 2023 | $12,584 | $968,000 | $697,000 | $271,000 |
| 2022 | $12,089 | $876,000 | $634,000 | $242,000 |
| 2021 | $11,685 | $812,000 | $578,000 | $234,000 |
| 2020 | $11,409 | $812,000 | $578,000 | $234,000 |
| 2019 | $10,957 | $776,000 | $550,000 | $226,000 |
| 2018 | $10,368 | $725,000 | $524,000 | $201,000 |
| 2017 | $10,360 | $715,000 | $513,000 | $202,000 |
| 2016 | $9,665 | $662,000 | $467,000 | $195,000 |
| 2015 | $9,258 | $623,000 | $424,000 | $199,000 |
| 2014 | $8,562 | $552,000 | $386,000 | $166,000 |
Map
- 329 Bedford St
- 329 Bedford St Unit 329
- 329 Bedford St Unit 1
- 325 Bedford St
- 337 Bedford St
- 323 Bedford St
- 62 Harding Rd
- 330 Bedford St
- 60 Harding Rd
- 64 Harding Rd
- 339 Bedford St
- 320 Bedford St Unit 1
- 6 Cider Mill Ln
- 6 Cider Mill Ln
- 58 Harding Rd
- 321 Bedford St
- 341 Bedford St
- 8 Cider Mill Ln
- 56 Harding Rd
- 68 Harding Rd
Ask me questions while you tour the home.