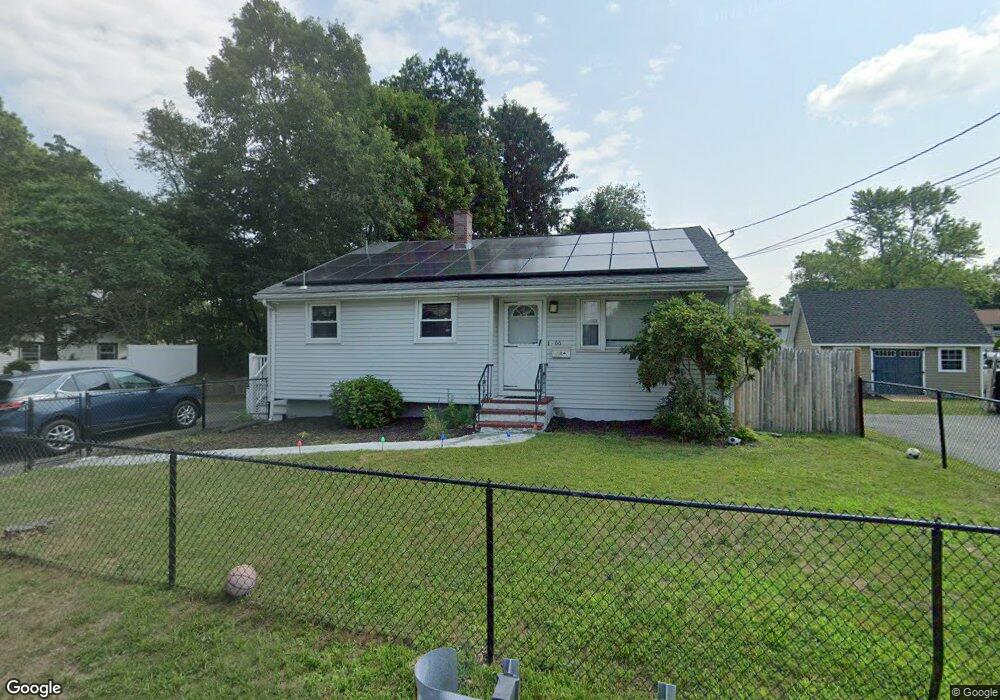
66 Hobson St Brockton, MA 02302
Estimated Value: $450,000 - $530,000
3
Beds
1
Bath
1,316
Sq Ft
$369/Sq Ft
Est. Value
About This Home
This home is located at 66 Hobson St, Brockton, MA 02302 and is currently estimated at $485,914, approximately $369 per square foot. 66 Hobson St is a home located in Plymouth County with nearby schools including Brookfield Elementary School, Downey Elementary School, and Ashfield Middle School.
Ownership History
Date
Name
Owned For
Owner Type
Purchase Details
Closed on
Apr 19, 2016
Sold by
Depina Luis H and Gomes Ellie V
Bought by
Amado Ellie G
Current Estimated Value
Home Financials for this Owner
Home Financials are based on the most recent Mortgage that was taken out on this home.
Original Mortgage
$145,500
Outstanding Balance
$115,439
Interest Rate
3.64%
Mortgage Type
New Conventional
Estimated Equity
$370,475
Purchase Details
Closed on
May 20, 2009
Sold by
Levine Stanley S and Levine Terri S
Bought by
Gomes Ellie and Depina Luis H
Home Financials for this Owner
Home Financials are based on the most recent Mortgage that was taken out on this home.
Original Mortgage
$162,011
Interest Rate
4.93%
Mortgage Type
Purchase Money Mortgage
Purchase Details
Closed on
Feb 22, 1995
Sold by
Victor Aroll and Victor Marie L
Bought by
Levine Stanley S and Levine Terri S
Create a Home Valuation Report for This Property
The Home Valuation Report is an in-depth analysis detailing your home's value as well as a comparison with similar homes in the area
Home Values in the Area
Average Home Value in this Area
Purchase History
| Date | Buyer | Sale Price | Title Company |
|---|---|---|---|
| Amado Ellie G | -- | -- | |
| Gomes Ellie | $165,000 | -- | |
| Levine Stanley S | $95,981 | -- |
Source: Public Records
Mortgage History
| Date | Status | Borrower | Loan Amount |
|---|---|---|---|
| Open | Amado Ellie G | $145,500 | |
| Previous Owner | Levine Stanley S | $162,011 |
Source: Public Records
Tax History Compared to Growth
Tax History
| Year | Tax Paid | Tax Assessment Tax Assessment Total Assessment is a certain percentage of the fair market value that is determined by local assessors to be the total taxable value of land and additions on the property. | Land | Improvement |
|---|---|---|---|---|
| 2025 | $4,935 | $407,500 | $143,800 | $263,700 |
| 2024 | $4,670 | $388,500 | $143,800 | $244,700 |
| 2023 | $4,514 | $347,800 | $108,400 | $239,400 |
| 2022 | $4,340 | $310,700 | $98,400 | $212,300 |
| 2021 | $3,932 | $271,200 | $90,300 | $180,900 |
| 2020 | $3,928 | $259,300 | $86,800 | $172,500 |
| 2019 | $3,848 | $247,600 | $79,900 | $167,700 |
| 2018 | $2,935 | $208,800 | $79,900 | $128,900 |
| 2017 | $2,935 | $182,300 | $79,900 | $102,400 |
| 2016 | $3,002 | $172,900 | $76,200 | $96,700 |
| 2015 | $2,946 | $162,300 | $76,200 | $86,100 |
| 2014 | $2,759 | $152,200 | $76,200 | $76,000 |
Source: Public Records
Map
Nearby Homes