66 Hollis St Pepperell, MA 01463
Estimated Value: $418,269
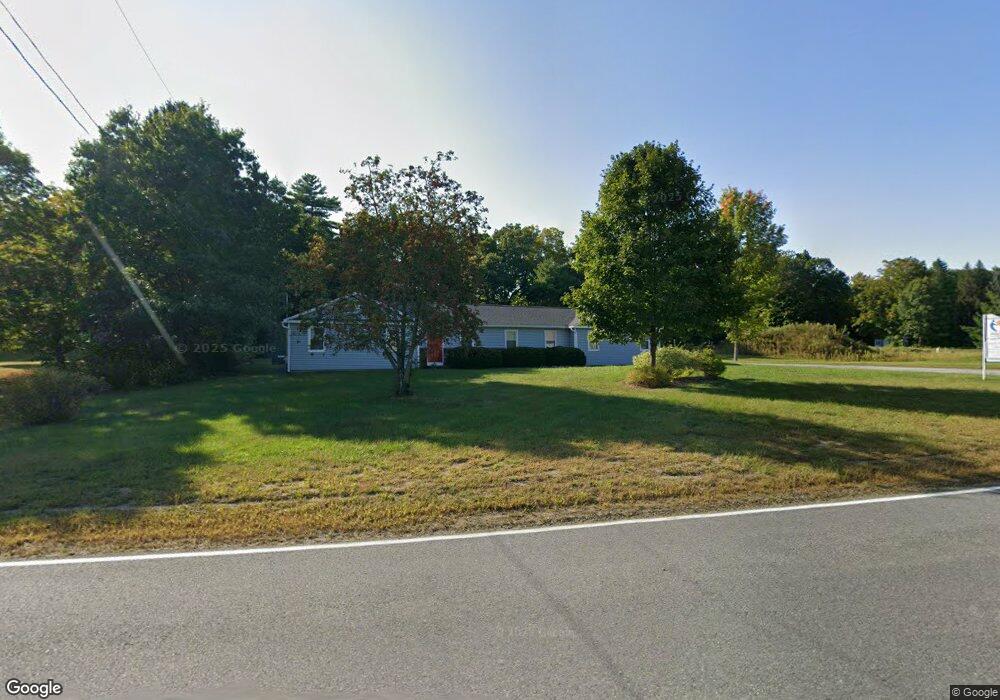
About This Home
This home is located at 66 Hollis St, Pepperell, MA 01463 and is currently estimated at $418,269, approximately $189 per square foot. 66 Hollis St is a home located in Middlesex County with nearby schools including North Middlesex Regional High School, Pepperell Christian Academy, and Maple Dene & Moppet School.
Ownership History
We collect this data history from publicly available records. To have your information removed, we recommend requesting removal directly through your county’s website.
Purchase Details
Home Financials for this Owner
Home Financials are based on the most recent Mortgage that was taken out on this home.Purchase Details
Home Values in the Area
Average Home Value in this Area
Purchase History
We collect this data history from publicly available records. To have your information removed, we recommend requesting removal directly through your county’s website.
| Date | Buyer | Sale Price | Title Company |
|---|---|---|---|
| $250,000 | -- | ||
| $370,000 | -- | ||
| $370,000 | -- |
Mortgage History
We collect this data history from publicly available records. To have your information removed, we recommend requesting removal directly through your county’s website.
| Date | Status | Borrower | Loan Amount |
|---|---|---|---|
| Open | $200,000 |
Tax History
We collect this data history from publicly available records. To have your information removed, we recommend requesting removal directly through your county’s website.
| Year | Tax Paid | Tax Assessment Tax Assessment Total Assessment is a certain percentage of the fair market value that is determined by local assessors to be the total taxable value of land and additions on the property. | Land | Improvement |
|---|---|---|---|---|
| 2025 | $0 | $410,400 | $250,800 | $159,600 |
| 2024 | $0 | $393,200 | $240,400 | $152,800 |
| 2023 | $4,914 | $375,900 | $229,900 | $146,000 |
| 2022 | $4,914 | $349,700 | $198,600 | $151,100 |
| 2021 | $0 | $147,200 | $0 | $147,200 |
| 2020 | $14,312 | $349,700 | $198,600 | $151,100 |
| 2019 | $4,914 | $296,200 | $177,700 | $118,500 |
| 2018 | $6,743 | $411,400 | $177,700 | $233,700 |
| 2017 | $13,376 | $385,900 | $156,200 | $229,700 |
| 2016 | $6,379 | $385,900 | $156,200 | $229,700 |
| 2015 | $6,155 | $385,900 | $156,200 | $229,700 |
| 2014 | $5,166 | $325,700 | $95,400 | $230,300 |
Map
- 59 Mill St
- 24 Nashua Rd Unit 1
- 12 Brookline St
- 26 Groton St
- 5 Mill St
- 69 Main St Unit 71
- 103 Main St Unit 10
- 103 Main St Unit 18
- 103 Main St Unit 16
- 11 Province St
- 3 Suncook Dr
- 3 Chamberlain Way
- 13 Deerfield Dr
- 42 Lowell Rd
- 4 Townsend St
- 5 Nursery Rd
- 21 Heald St
- 99 Brookline St
- 9 Oakland Rd
- 18 Plainfield Rd
Ask me questions while you tour the home.