
66 Howard St Brockton, MA 02301
Montello NeighborhoodEstimated payment $5,764/month
Highlights
- Deck
- 4-minute walk to Montello
- 3 Fireplaces
- Property is near public transit
- Wood Flooring
- Corner Lot
About This Home
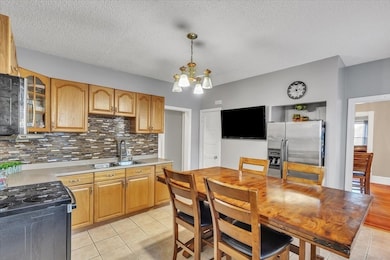
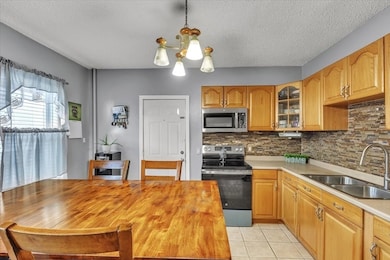
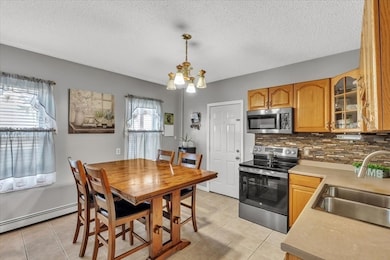
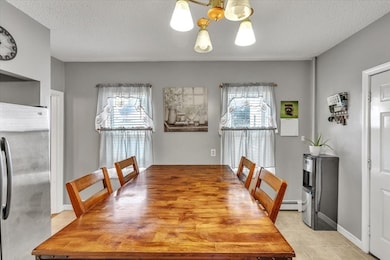
Open House: 11/08 and 11/09 from 11AM to 1PM. Spacious and well-maintained 3-family home in a prime Brockton location! This impressive 4,788 sq. ft. property offers generous living space in each unit, featuring 3 bedrooms (with potential for a 4th), an eat-in kitchen, and a classic double parlor layout, providing ample living and dining areas. Beautiful hardwood floors run throughout all units, adding warmth and charm to every level. Additional features include a two-car garage and additional living space in the finished basement. Conveniently located near schools, shopping, highway and public transportation. Whether you’re looking to expand your portfolio or a place to call home, this property checks all the boxes!
Property Details
Home Type
- Multi-Family
Est. Annual Taxes
- $9,141
Year Built
- Built in 1925
Lot Details
- 5,532 Sq Ft Lot
- Corner Lot
- Cleared Lot
Parking
- 1 Car Garage
- Driveway
- Open Parking
- Off-Street Parking
Home Design
- Frame Construction
- Shingle Roof
- Concrete Perimeter Foundation
Interior Spaces
- Property has 1 Level
- Ceiling Fan
- 3 Fireplaces
- Living Room
- Dining Room
- Washer Hookup
Kitchen
- Range
- Microwave
Flooring
- Wood
- Tile
Bedrooms and Bathrooms
- 9 Bedrooms
- 4 Full Bathrooms
- Bathtub
Partially Finished Basement
- Walk-Out Basement
- Basement Fills Entire Space Under The House
- Interior Basement Entry
Outdoor Features
- Deck
- Covered Patio or Porch
- Rain Gutters
Location
- Property is near public transit
- Property is near schools
Utilities
- Window Unit Cooling System
- Heating System Uses Natural Gas
- Baseboard Heating
- Hot Water Heating System
- 100 Amp Service
Listing and Financial Details
- Assessor Parcel Number M:102 R:064 S:,963259
Community Details
Recreation
- Park
Additional Features
- 3 Units
- Coin Laundry
Map
Home Values in the Area
Average Home Value in this Area
Tax History
| Year | Tax Paid | Tax Assessment Tax Assessment Total Assessment is a certain percentage of the fair market value that is determined by local assessors to be the total taxable value of land and additions on the property. | Land | Improvement |
|---|---|---|---|---|
| 2025 | $9,141 | $754,800 | $135,900 | $618,900 |
| 2024 | $9,112 | $758,100 | $135,900 | $622,200 |
| 2023 | $8,341 | $642,600 | $101,800 | $540,800 |
| 2022 | $8,118 | $581,100 | $92,300 | $488,800 |
| 2021 | $7,752 | $534,600 | $76,300 | $458,300 |
| 2020 | $7,540 | $497,700 | $72,000 | $425,700 |
| 2019 | $7,223 | $464,800 | $69,500 | $395,300 |
| 2018 | $6,567 | $408,900 | $69,500 | $339,400 |
| 2017 | $6,229 | $386,900 | $69,500 | $317,400 |
| 2016 | $4,566 | $263,000 | $67,300 | $195,700 |
| 2015 | $3,278 | $180,600 | $67,300 | $113,300 |
| 2014 | $3,102 | $171,100 | $67,300 | $103,800 |
Property History
| Date | Event | Price | List to Sale | Price per Sq Ft |
|---|---|---|---|---|
| 11/12/2025 11/12/25 | Pending | -- | -- | -- |
| 11/03/2025 11/03/25 | For Sale | $949,999 | -- | $198 / Sq Ft |
Purchase History
| Date | Type | Sale Price | Title Company |
|---|---|---|---|
| Warranty Deed | $190,000 | -- | |
| Deed | $117,000 | -- | |
| Deed | $10,500 | -- | |
| Foreclosure Deed | $19,600 | -- | |
| Deed | $190,000 | -- |
Mortgage History
| Date | Status | Loan Amount | Loan Type |
|---|---|---|---|
| Open | $33,000 | No Value Available | |
| Closed | $35,000 | No Value Available |
Source: MLS Property Information Network (MLS PIN)
MLS Number: 73450684
APN: BROC-000102-000064
Disclaimer: Certain information contained herein is derived from information provided by parties other than Homes.com. All information provided is deemed reliable, but is not guaranteed to be accurate and should be independently verified.
![]() The property listing data and information, or the Images, set forth herein were provided to MLS Property Information Network, Inc. from third party sources, including sellers, lessors and public records, and were compiled by MLS Property Information Network, Inc. The property listing data and information, and the Images, are for the personal, non-commercial use of consumers having a good faith interest in purchasing or leasing listed properties of the type displayed to them and may not be used for any purpose other than to identify prospective properties which such consumers may have a good faith interest in purchasing or leasing. MLS Property Information Network, Inc. and its subscribers disclaim any and all representations and warranties as to the accuracy of the property listing data and information, or as to the accuracy of any of the Images, set forth herein.
The property listing data and information, or the Images, set forth herein were provided to MLS Property Information Network, Inc. from third party sources, including sellers, lessors and public records, and were compiled by MLS Property Information Network, Inc. The property listing data and information, and the Images, are for the personal, non-commercial use of consumers having a good faith interest in purchasing or leasing listed properties of the type displayed to them and may not be used for any purpose other than to identify prospective properties which such consumers may have a good faith interest in purchasing or leasing. MLS Property Information Network, Inc. and its subscribers disclaim any and all representations and warranties as to the accuracy of the property listing data and information, or as to the accuracy of any of the Images, set forth herein.
