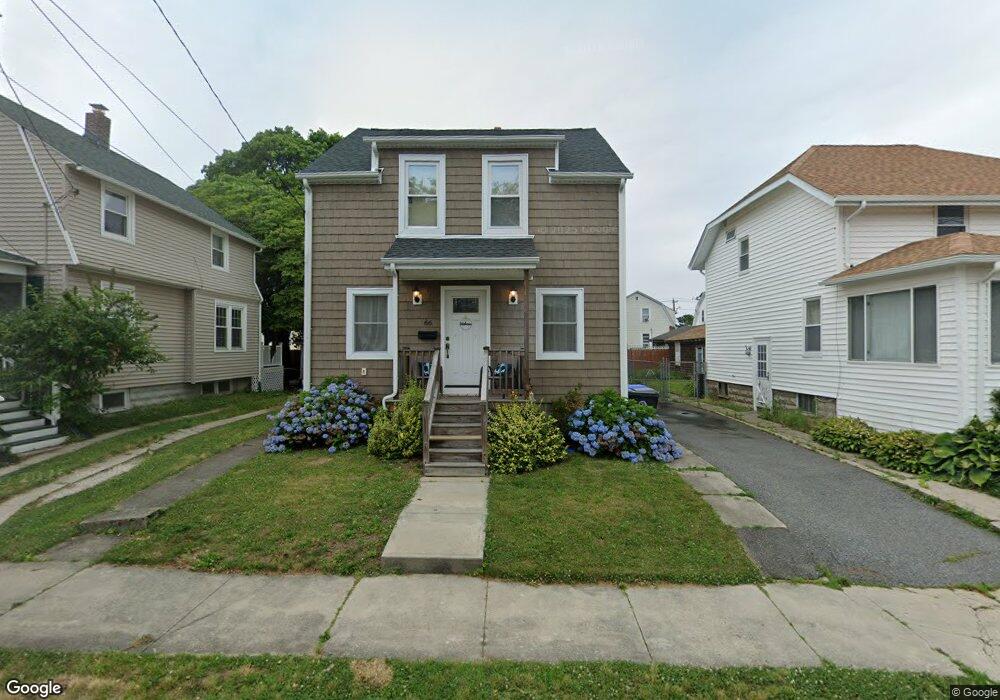
66 James St East Providence, RI 02914
Estimated Value: $372,000 - $423,000
3
Beds
2
Baths
1,424
Sq Ft
$280/Sq Ft
Est. Value
About This Home
This home is located at 66 James St, East Providence, RI 02914 and is currently estimated at $398,546, approximately $279 per square foot. 66 James St is a home located in Providence County with nearby schools including East Providence High School, Ocean State Montessori School, and French-American School of Rhode Island.
Ownership History
Date
Name
Owned For
Owner Type
Purchase Details
Closed on
Jul 11, 2012
Sold by
Machado John P
Bought by
Machado John P and Machado Gail L
Current Estimated Value
Purchase Details
Closed on
Oct 28, 1994
Sold by
Pona Curtis F and Pona Angela
Bought by
Machado John P
Home Financials for this Owner
Home Financials are based on the most recent Mortgage that was taken out on this home.
Original Mortgage
$67,700
Interest Rate
8.65%
Mortgage Type
Purchase Money Mortgage
Create a Home Valuation Report for This Property
The Home Valuation Report is an in-depth analysis detailing your home's value as well as a comparison with similar homes in the area
Home Values in the Area
Average Home Value in this Area
Purchase History
| Date | Buyer | Sale Price | Title Company |
|---|---|---|---|
| Machado John P | -- | -- | |
| Machado John P | $79,500 | -- | |
| Machado John P | -- | -- | |
| Machado John P | $79,500 | -- |
Source: Public Records
Mortgage History
| Date | Status | Borrower | Loan Amount |
|---|---|---|---|
| Previous Owner | Machado John P | $67,700 |
Source: Public Records
Tax History Compared to Growth
Tax History
| Year | Tax Paid | Tax Assessment Tax Assessment Total Assessment is a certain percentage of the fair market value that is determined by local assessors to be the total taxable value of land and additions on the property. | Land | Improvement |
|---|---|---|---|---|
| 2025 | $4,773 | $365,200 | $85,900 | $279,300 |
| 2024 | $4,364 | $284,700 | $71,600 | $213,100 |
| 2023 | $4,202 | $284,700 | $71,600 | $213,100 |
| 2022 | $4,177 | $191,100 | $40,700 | $150,400 |
| 2021 | $4,109 | $191,100 | $37,900 | $153,200 |
| 2020 | $3,935 | $191,100 | $37,900 | $153,200 |
| 2019 | $3,826 | $191,100 | $37,900 | $153,200 |
| 2018 | $3,320 | $145,100 | $39,600 | $105,500 |
| 2017 | $3,246 | $145,100 | $39,600 | $105,500 |
| 2016 | $3,292 | $147,900 | $39,600 | $108,300 |
| 2015 | $3,078 | $134,100 | $32,100 | $102,000 |
| 2014 | $3,078 | $134,100 | $32,100 | $102,000 |
Source: Public Records
Map
Nearby Homes
- 91 Ivy St
- 181 Summit St
- 58 Central Ave
- 115 Sutton Ave
- 58 Summit St
- 152 Freeborn Ave
- 200 Woodward Ave
- 661 N Broadway
- 674 N Broadway
- 15 S Carpenter St
- 4 S Carpenter St
- 18 Baker St Unit 20
- 93 Warren Ave
- 89 Warren Ave
- 320 Mauran Ave
- 270 Woodward Ave
- 51 7th St
- 41 What Cheer Ave
- 55 Second St
- 228 Medway St