Estimated Value: $554,109 - $616,000
3
Beds
1
Bath
1,065
Sq Ft
$557/Sq Ft
Est. Value
About This Home
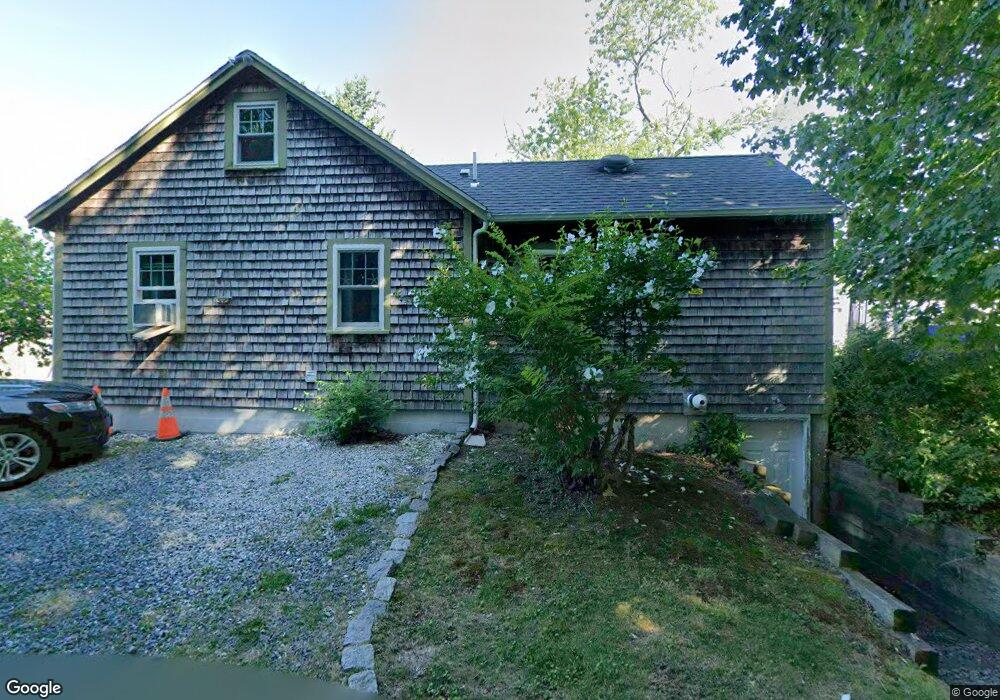
This home is located at 66 June St, Marshfield, MA 02050 and is currently estimated at $592,777, approximately $556 per square foot. 66 June St is a home located in Plymouth County with nearby schools including Governor Edward Winslow School, Furnace Brook Middle School, and Marshfield High School.
Ownership History
Date
Name
Owned For
Owner Type
Purchase Details
Closed on
Nov 12, 2010
Sold by
Shea Frances I
Bought by
Kitchens David F and Kitchens Lissa D
Current Estimated Value
Home Financials for this Owner
Home Financials are based on the most recent Mortgage that was taken out on this home.
Original Mortgage
$261,504
Outstanding Balance
$171,889
Interest Rate
4.35%
Mortgage Type
Purchase Money Mortgage
Estimated Equity
$420,888
Purchase Details
Closed on
Jun 22, 2005
Sold by
Kantarowski Brian S
Bought by
Shea Frances I
Home Financials for this Owner
Home Financials are based on the most recent Mortgage that was taken out on this home.
Original Mortgage
$155,000
Interest Rate
5.82%
Mortgage Type
Purchase Money Mortgage
Purchase Details
Closed on
Sep 25, 2001
Sold by
Campbell Robert L
Bought by
Kantarowski Brian S
Create a Home Valuation Report for This Property
The Home Valuation Report is an in-depth analysis detailing your home's value as well as a comparison with similar homes in the area
Home Values in the Area
Average Home Value in this Area
Purchase History
| Date | Buyer | Sale Price | Title Company |
|---|---|---|---|
| Kitchens David F | $256,000 | -- | |
| Kitchens David F | $256,000 | -- | |
| Shea Frances I | $327,000 | -- | |
| Shea Frances I | $327,000 | -- | |
| Kantarowski Brian S | $193,000 | -- | |
| Kantarowski Brian S | $193,000 | -- |
Source: Public Records
Mortgage History
| Date | Status | Borrower | Loan Amount |
|---|---|---|---|
| Open | Kitchens David F | $261,504 | |
| Closed | Kantarowski Brian S | $261,504 | |
| Previous Owner | Kantarowski Brian S | $155,000 |
Source: Public Records
Tax History Compared to Growth
Tax History
| Year | Tax Paid | Tax Assessment Tax Assessment Total Assessment is a certain percentage of the fair market value that is determined by local assessors to be the total taxable value of land and additions on the property. | Land | Improvement |
|---|---|---|---|---|
| 2025 | $4,378 | $442,200 | $318,400 | $123,800 |
| 2024 | $4,327 | $416,500 | $298,500 | $118,000 |
| 2023 | $4,138 | $365,600 | $268,700 | $96,900 |
| 2022 | $4,138 | $319,500 | $228,900 | $90,600 |
| 2021 | $3,920 | $297,200 | $218,900 | $78,300 |
| 2020 | $3,502 | $262,700 | $189,100 | $73,600 |
| 2019 | $3,451 | $257,900 | $189,100 | $68,800 |
| 2018 | $3,448 | $257,900 | $189,100 | $68,800 |
| 2017 | $3,239 | $236,100 | $179,100 | $57,000 |
| 2016 | $3,363 | $242,300 | $169,200 | $73,100 |
| 2015 | $3,220 | $242,300 | $169,200 | $73,100 |
| 2014 | $3,237 | $243,600 | $169,200 | $74,400 |
Source: Public Records
Map
Nearby Homes