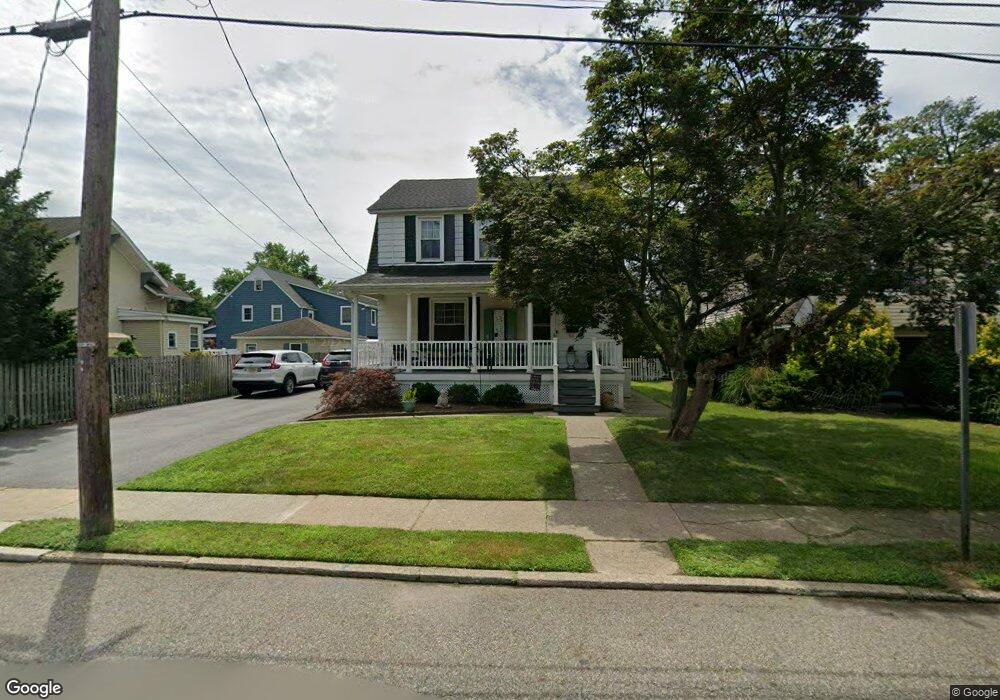
66 Lenox Ave Pompton Lakes, NJ 07442
Estimated Value: $443,000 - $562,000
--
Bed
--
Bath
1,394
Sq Ft
$364/Sq Ft
Est. Value
About This Home
This home is located at 66 Lenox Ave, Pompton Lakes, NJ 07442 and is currently estimated at $507,916, approximately $364 per square foot. 66 Lenox Ave is a home located in Passaic County with nearby schools including Pompton Lakes High School and St Marys School.
Ownership History
Date
Name
Owned For
Owner Type
Purchase Details
Closed on
Oct 31, 2006
Sold by
Exrx Floyd L Moreland
Bought by
Welsch Keith and Carde Bathsheba A
Current Estimated Value
Home Financials for this Owner
Home Financials are based on the most recent Mortgage that was taken out on this home.
Original Mortgage
$261,600
Outstanding Balance
$155,780
Interest Rate
6.33%
Estimated Equity
$352,136
Purchase Details
Closed on
Sep 23, 2002
Sold by
Pierce Edith
Bought by
Hanania Matthew and Hanania Louise
Home Financials for this Owner
Home Financials are based on the most recent Mortgage that was taken out on this home.
Original Mortgage
$150,000
Interest Rate
6.27%
Create a Home Valuation Report for This Property
The Home Valuation Report is an in-depth analysis detailing your home's value as well as a comparison with similar homes in the area
Home Values in the Area
Average Home Value in this Area
Purchase History
| Date | Buyer | Sale Price | Title Company |
|---|---|---|---|
| Welsch Keith | $327,000 | -- | |
| Hanania Matthew | $240,000 | -- |
Source: Public Records
Mortgage History
| Date | Status | Borrower | Loan Amount |
|---|---|---|---|
| Open | Welsch Keith | $261,600 | |
| Previous Owner | Hanania Matthew | $150,000 |
Source: Public Records
Tax History Compared to Growth
Tax History
| Year | Tax Paid | Tax Assessment Tax Assessment Total Assessment is a certain percentage of the fair market value that is determined by local assessors to be the total taxable value of land and additions on the property. | Land | Improvement |
|---|---|---|---|---|
| 2025 | $12,121 | $307,400 | $136,500 | $170,900 |
| 2024 | $11,789 | $307,400 | $136,500 | $170,900 |
| 2022 | $11,700 | $307,400 | $136,500 | $170,900 |
| 2021 | $11,574 | $307,400 | $136,500 | $170,900 |
| 2020 | $11,549 | $307,400 | $136,500 | $170,900 |
| 2019 | $11,227 | $306,000 | $136,500 | $169,500 |
| 2018 | $11,031 | $306,000 | $136,500 | $169,500 |
| 2017 | $9,291 | $133,600 | $64,400 | $69,200 |
| 2016 | $8,907 | $129,500 | $64,400 | $65,100 |
| 2015 | $8,847 | $129,500 | $64,400 | $65,100 |
| 2014 | $8,591 | $129,500 | $64,400 | $65,100 |
Source: Public Records
Map
Nearby Homes