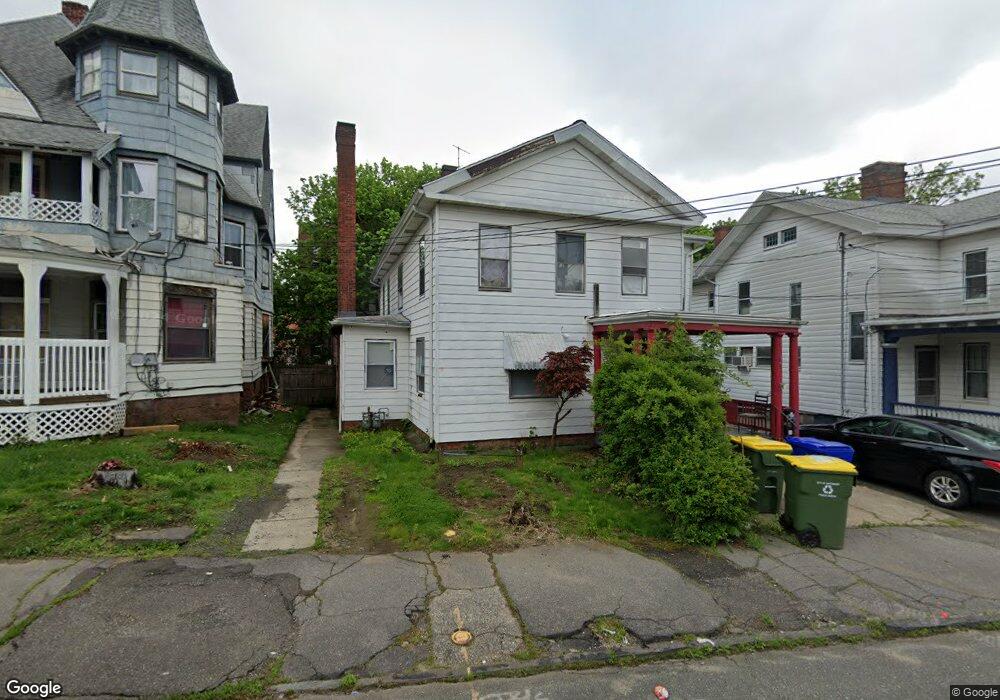
66 Linden St Waterbury, CT 06702
Village of Waterbury NeighborhoodEstimated Value: $239,573 - $348,000
4
Beds
2
Baths
2,370
Sq Ft
$128/Sq Ft
Est. Value
About This Home
This home is located at 66 Linden St, Waterbury, CT 06702 and is currently estimated at $303,643, approximately $128 per square foot. 66 Linden St is a home with nearby schools including West Side Middle School, John F. Kennedy High School, and Bais Yaakov of Waterbury High School.
Ownership History
Date
Name
Owned For
Owner Type
Purchase Details
Closed on
Jun 21, 2013
Sold by
Lipsky Fox Llc
Bought by
Union Sb
Current Estimated Value
Purchase Details
Closed on
Nov 14, 2008
Sold by
Healey Building Inc
Bought by
Lipsky Fox Llc
Home Financials for this Owner
Home Financials are based on the most recent Mortgage that was taken out on this home.
Original Mortgage
$70,000
Interest Rate
6.9%
Mortgage Type
Commercial
Create a Home Valuation Report for This Property
The Home Valuation Report is an in-depth analysis detailing your home's value as well as a comparison with similar homes in the area
Home Values in the Area
Average Home Value in this Area
Purchase History
| Date | Buyer | Sale Price | Title Company |
|---|---|---|---|
| Union Sb | -- | -- | |
| Lipsky Fox Llc | $87,500 | -- |
Source: Public Records
Mortgage History
| Date | Status | Borrower | Loan Amount |
|---|---|---|---|
| Previous Owner | Lipsky Fox Llc | $70,000 |
Source: Public Records
Tax History
| Year | Tax Paid | Tax Assessment Tax Assessment Total Assessment is a certain percentage of the fair market value that is determined by local assessors to be the total taxable value of land and additions on the property. | Land | Improvement |
|---|---|---|---|---|
| 2025 | $3,722 | $82,740 | $6,440 | $76,300 |
| 2024 | $4,091 | $82,740 | $6,440 | $76,300 |
| 2023 | $4,484 | $82,740 | $6,440 | $76,300 |
| 2022 | $2,379 | $39,520 | $6,470 | $33,050 |
| 2021 | $2,379 | $39,520 | $6,470 | $33,050 |
| 2020 | $2,379 | $39,520 | $6,470 | $33,050 |
| 2019 | $2,379 | $39,520 | $6,470 | $33,050 |
| 2018 | $2,379 | $39,520 | $6,470 | $33,050 |
| 2017 | $2,357 | $39,140 | $6,470 | $32,670 |
| 2016 | $2,357 | $39,140 | $6,470 | $32,670 |
| 2015 | $3,568 | $61,280 | $10,400 | $50,880 |
| 2014 | $3,568 | $61,280 | $10,400 | $50,880 |
Source: Public Records
Map
Nearby Homes
Your Personal Tour Guide
Ask me questions while you tour the home.