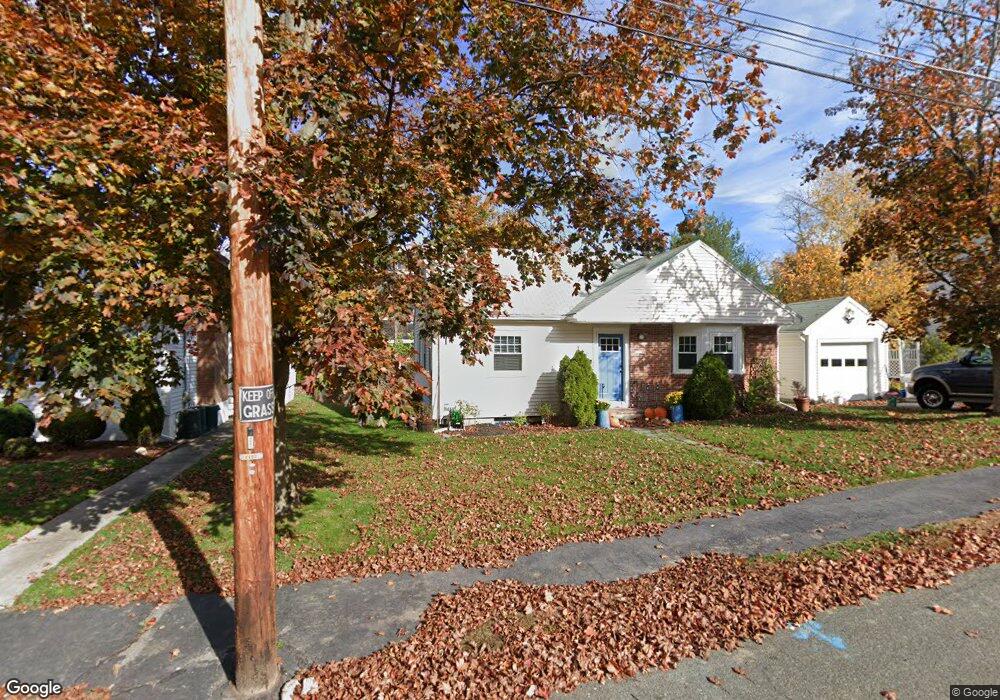
66 Main St Unit 39A Stoneham, MA 02180
Bear Hill NeighborhoodEstimated Value: $389,000 - $419,000
2
Beds
1
Bath
919
Sq Ft
$436/Sq Ft
Est. Value
About This Home
This home is located at 66 Main St Unit 39A, Stoneham, MA 02180 and is currently estimated at $400,839, approximately $436 per square foot. 66 Main St Unit 39A is a home located in Middlesex County with nearby schools including Stoneham High School, St. Patrick Elementary School, and St Joseph School.
Ownership History
Date
Name
Owned For
Owner Type
Purchase Details
Closed on
Jul 1, 2024
Sold by
Sartor Carole M and Cioffi Clifford A
Bought by
Sartor Carole M and Cioffi Clifford A
Current Estimated Value
Purchase Details
Closed on
Apr 26, 2022
Sold by
Powers M Catherine
Bought by
Sartor Carole M
Purchase Details
Closed on
Sep 5, 2019
Sold by
Gosselin Ft
Bought by
Cioffi Clifford A and Sartor Carole M
Purchase Details
Closed on
Aug 31, 1995
Sold by
Kurtz Christine A
Bought by
Gosselin Rt and Gosselin Frank J
Purchase Details
Closed on
Nov 30, 1990
Sold by
Est Knuepfer Robert
Bought by
Kurtz Christine A
Home Financials for this Owner
Home Financials are based on the most recent Mortgage that was taken out on this home.
Original Mortgage
$60,000
Interest Rate
10.16%
Mortgage Type
Purchase Money Mortgage
Create a Home Valuation Report for This Property
The Home Valuation Report is an in-depth analysis detailing your home's value as well as a comparison with similar homes in the area
Home Values in the Area
Average Home Value in this Area
Purchase History
| Date | Buyer | Sale Price | Title Company |
|---|---|---|---|
| Sartor Carole M | -- | None Available | |
| Sartor Carole M | -- | None Available | |
| Sartor Carole M | $70,000 | None Available | |
| Cioffi Clifford A | -- | None Available | |
| Gosselin Rt | $84,000 | -- | |
| Gosselin Rt | $84,000 | -- | |
| Kurtz Christine A | $85,000 | -- | |
| Kurtz Christine A | $85,000 | -- |
Source: Public Records
Mortgage History
| Date | Status | Borrower | Loan Amount |
|---|---|---|---|
| Previous Owner | Kurtz Christine A | $60,000 |
Source: Public Records
Tax History
| Year | Tax Paid | Tax Assessment Tax Assessment Total Assessment is a certain percentage of the fair market value that is determined by local assessors to be the total taxable value of land and additions on the property. | Land | Improvement |
|---|---|---|---|---|
| 2025 | $3,553 | $347,300 | $0 | $347,300 |
| 2024 | $3,551 | $335,300 | $0 | $335,300 |
| 2023 | $3,369 | $303,500 | $0 | $303,500 |
| 2022 | $2,939 | $282,300 | $0 | $282,300 |
| 2021 | $2,959 | $273,500 | $0 | $273,500 |
| 2020 | $2,790 | $258,600 | $0 | $258,600 |
| 2019 | $2,753 | $245,400 | $0 | $245,400 |
| 2018 | $2,575 | $219,900 | $0 | $219,900 |
| 2017 | $2,334 | $188,400 | $0 | $188,400 |
| 2016 | $2,339 | $184,200 | $0 | $184,200 |
| 2015 | $2,157 | $166,400 | $0 | $166,400 |
| 2014 | $2,172 | $161,000 | $0 | $161,000 |
Source: Public Records
Map
Nearby Homes
- 66 Main St Unit 15A
- 12 Isola Ln
- 64 Main St Unit 24B
- 68 Main St Unit 21C
- 98 Main St Unit 2
- 62 High St Unit Lot 8
- 62 High St Unit 4
- 62 High St Unit Lot 5
- 62 High St Unit Lot 7
- 62 High St Unit Lot 12
- 62 High St Unit 3
- 8 Steele St
- 159 Main St Unit 27C
- 159 Main St Unit 39A
- 10 Rodgers Rd
- 23 Sunrise Ave
- 313 South St
- 1 Summit Dr Unit 57
- 403 Gazebo Cir
- 2 Summit Dr Unit 43
- 66 Main St Unit 59A
- 66 Main St Unit 57A
- 66 Main St Unit 56A
- 66 Main St Unit 55A
- 66 Main St Unit 54A
- 66 Main St Unit 53A
- 66 Main St Unit 52A
- 66 Main St Unit 51A
- 66 Main St Unit 49A
- 66 Main St Unit 48A
- 66 Main St Unit 47A
- 66 Main St Unit 46A
- 66 Main St Unit 45A
- 66 Main St Unit 44A
- 66 Main St Unit 43A
- 66 Main St Unit 42A
- 66 Main St Unit 41A
- 66 Main St Unit 38A
- 66 Main St Unit 36A
- 66 Main St Unit 35A
Your Personal Tour Guide
Ask me questions while you tour the home.