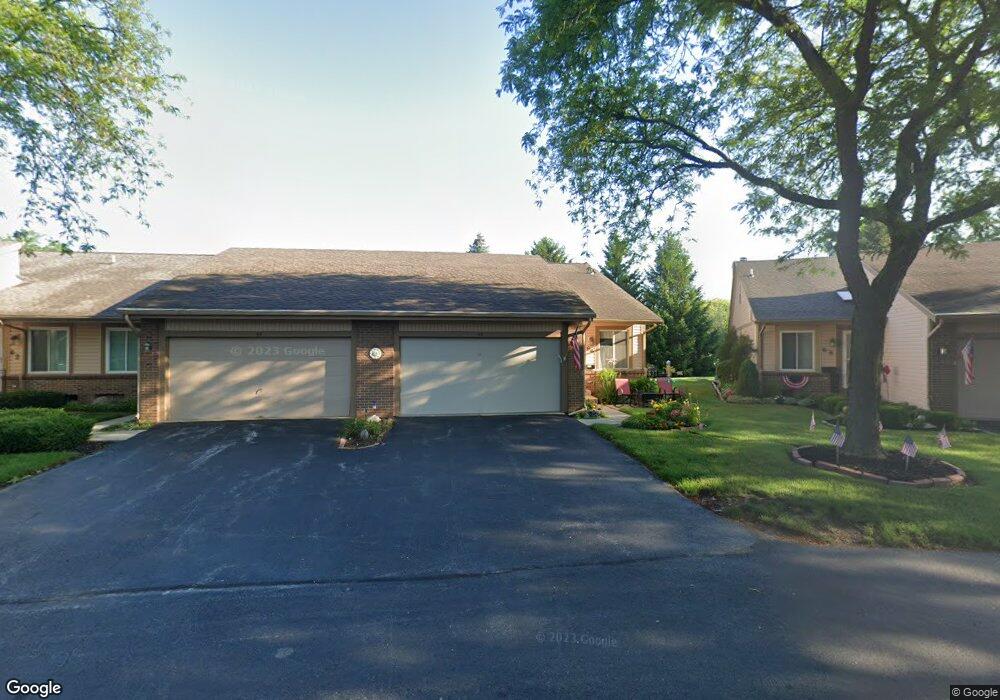
66 Mallard Run Unit 66 Maumee, OH 43537
Estimated Value: $187,444 - $202,000
2
Beds
2
Baths
1,593
Sq Ft
$123/Sq Ft
Est. Value
About This Home
This home is located at 66 Mallard Run Unit 66, Maumee, OH 43537 and is currently estimated at $196,111, approximately $123 per square foot. 66 Mallard Run Unit 66 is a home located in Lucas County with nearby schools including Fairfield Elementary School, Maumee Intermediate School, and Maumee Middle School.
Ownership History
Date
Name
Owned For
Owner Type
Purchase Details
Closed on
May 18, 2017
Sold by
Mueller Paul M and Mueller Julia R
Bought by
Thacker Jess M and Thacker Angela J
Current Estimated Value
Home Financials for this Owner
Home Financials are based on the most recent Mortgage that was taken out on this home.
Original Mortgage
$111,625
Outstanding Balance
$92,109
Interest Rate
4.08%
Mortgage Type
New Conventional
Estimated Equity
$104,002
Purchase Details
Closed on
Aug 18, 2006
Sold by
Clark Bonnie Lou
Bought by
Mueller Paul M and Mueller Julia R
Home Financials for this Owner
Home Financials are based on the most recent Mortgage that was taken out on this home.
Original Mortgage
$125,600
Interest Rate
6.83%
Mortgage Type
Purchase Money Mortgage
Purchase Details
Closed on
May 19, 1999
Sold by
Hodge Phyllis R
Bought by
Hodge Phyllis R and Hodge 1999 Revocable Trust
Purchase Details
Closed on
Dec 1, 1992
Sold by
Hodge Herbert E and Hodge Phyllis
Create a Home Valuation Report for This Property
The Home Valuation Report is an in-depth analysis detailing your home's value as well as a comparison with similar homes in the area
Home Values in the Area
Average Home Value in this Area
Purchase History
| Date | Buyer | Sale Price | Title Company |
|---|---|---|---|
| Thacker Jess M | $117,500 | None Available | |
| Mueller Paul M | $157,000 | None Available | |
| Hodge Phyllis R | -- | -- | |
| -- | -- | -- |
Source: Public Records
Mortgage History
| Date | Status | Borrower | Loan Amount |
|---|---|---|---|
| Open | Thacker Jess M | $111,625 | |
| Closed | Mueller Paul M | $125,600 |
Source: Public Records
Tax History
| Year | Tax Paid | Tax Assessment Tax Assessment Total Assessment is a certain percentage of the fair market value that is determined by local assessors to be the total taxable value of land and additions on the property. | Land | Improvement |
|---|---|---|---|---|
| 2025 | -- | $57,295 | $6,370 | $50,925 |
| 2024 | $1,833 | $57,295 | $6,370 | $50,925 |
| 2023 | $3,237 | $43,155 | $5,250 | $37,905 |
| 2022 | $2,881 | $43,155 | $5,250 | $37,905 |
| 2021 | $3,045 | $43,155 | $5,250 | $37,905 |
| 2020 | $3,211 | $40,425 | $4,935 | $35,490 |
| 2019 | $3,131 | $40,425 | $4,935 | $35,490 |
| 2018 | $3,078 | $40,425 | $4,935 | $35,490 |
| 2017 | $3,085 | $39,515 | $4,830 | $34,685 |
| 2016 | $3,051 | $112,900 | $13,800 | $99,100 |
| 2015 | $3,036 | $112,900 | $13,800 | $99,100 |
| 2014 | $2,839 | $38,750 | $4,730 | $34,020 |
| 2013 | $2,839 | $38,750 | $4,730 | $34,020 |
Source: Public Records
Map
Nearby Homes
- 1269 Westfield Dr
- 357 Wrexham Ln Unit 101
- 611 Greenfield Dr
- 524 Bennington Dr
- 541 Dussel Dr
- 632 Brahier Ln
- 224 Sackett St
- 519 Sackett St
- 213 E Indiana Ave
- 2585 W Village Dr
- 212 E Indiana Ave
- 408 Clinton St
- 218 E John St
- 1371 Junior Dr
- 2311 Maryann Place
- 1036 River Rd
- 99 N Masters Ct
- 1419 7th St
- 5441 Cresthaven Ln
- 716 Ransom St
- 64 Mallard Run Unit 64
- 75 Mallard Run
- 79 Mallard Run Unit 79
- 60 Mallard Run
- 69 Mallard Run Unit 69
- 68 Mallard Run Unit 68
- 70 Mallard Run Unit 70
- 62 Mallard Run Unit 62
- 65 Mallard Run Unit 65
- 72 Mallard Run
- 82 Mallard Run
- 61 Mallard Run Unit 61
- 74 Mallard Run Unit 74
- 88 Mallard Run Unit 88
- 76 Mallard Run
- 78 Mallard Run
- 83 Mallard Run Unit 83
- 87 Mallard Run Unit 87
- 91 Mallard Run
- 80 Mallard Run Unit 80
Your Personal Tour Guide
Ask me questions while you tour the home.