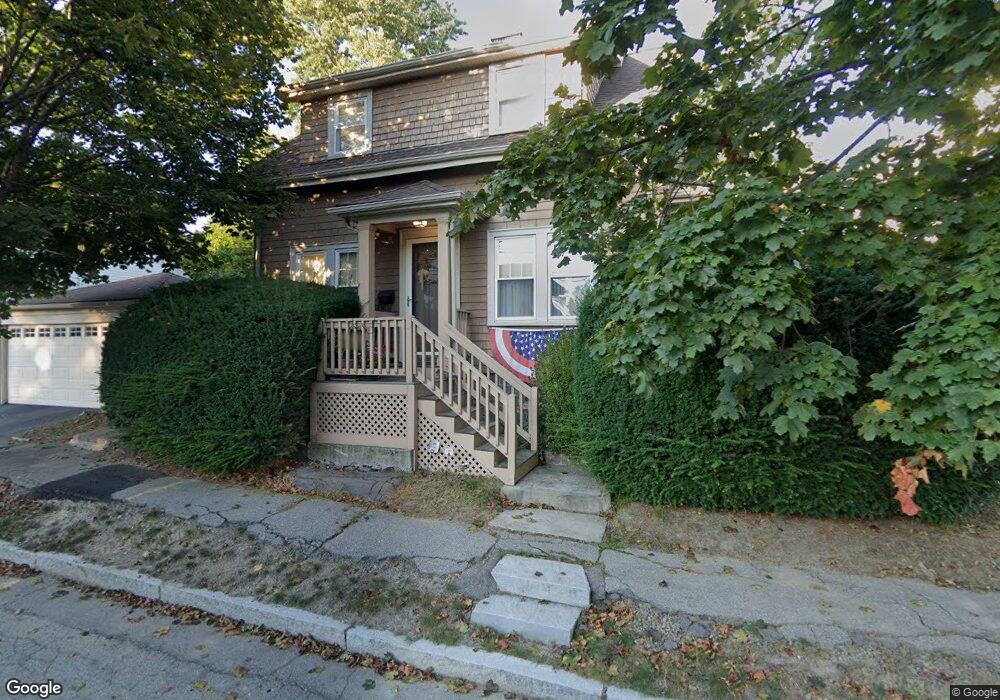
66 Marshall St Quincy, MA 02171
North Quincy NeighborhoodEstimated Value: $662,000 - $724,000
3
Beds
2
Baths
1,336
Sq Ft
$526/Sq Ft
Est. Value
About This Home
This home is located at 66 Marshall St, Quincy, MA 02171 and is currently estimated at $702,440, approximately $525 per square foot. 66 Marshall St is a home located in Norfolk County with nearby schools including Francis W. Parker Elementary School, Atlantic Middle School, and North Quincy High School.
Ownership History
Date
Name
Owned For
Owner Type
Purchase Details
Closed on
Sep 23, 2024
Sold by
Palmer Judith M
Bought by
Judith M Palmer 2024 Ret and Palmer
Current Estimated Value
Purchase Details
Closed on
Jun 11, 1993
Sold by
Stabile Jack A and Stabile Bonnie B
Bought by
Berkley George
Purchase Details
Closed on
Apr 4, 1990
Sold by
Ebel Travis M
Bought by
Stabile Jack A
Create a Home Valuation Report for This Property
The Home Valuation Report is an in-depth analysis detailing your home's value as well as a comparison with similar homes in the area
Home Values in the Area
Average Home Value in this Area
Purchase History
| Date | Buyer | Sale Price | Title Company |
|---|---|---|---|
| Judith M Palmer 2024 Ret | -- | None Available | |
| Judith M Palmer 2024 Ret | -- | None Available | |
| Berkley George | $123,000 | -- | |
| Stabile Jack A | $140,000 | -- |
Source: Public Records
Mortgage History
| Date | Status | Borrower | Loan Amount |
|---|---|---|---|
| Previous Owner | Stabile Jack A | $100,000 | |
| Previous Owner | Stabile Jack A | $49,200 | |
| Previous Owner | Stabile Jack A | $105,000 |
Source: Public Records
Tax History
| Year | Tax Paid | Tax Assessment Tax Assessment Total Assessment is a certain percentage of the fair market value that is determined by local assessors to be the total taxable value of land and additions on the property. | Land | Improvement |
|---|---|---|---|---|
| 2025 | $7,030 | $609,700 | $355,400 | $254,300 |
| 2024 | $6,765 | $600,300 | $355,400 | $244,900 |
| 2023 | $6,182 | $555,400 | $323,100 | $232,300 |
| 2022 | $5,840 | $487,500 | $258,500 | $229,000 |
| 2021 | $5,611 | $462,200 | $258,500 | $203,700 |
| 2020 | $5,483 | $441,100 | $253,400 | $187,700 |
| 2019 | $5,380 | $428,700 | $243,700 | $185,000 |
| 2018 | $5,329 | $399,500 | $232,100 | $167,400 |
| 2017 | $5,198 | $366,800 | $210,900 | $155,900 |
| 2016 | $4,877 | $339,600 | $191,800 | $147,800 |
| 2015 | $4,536 | $310,700 | $174,400 | $136,300 |
| 2014 | $4,407 | $296,600 | $174,400 | $122,200 |
Source: Public Records
Map
Nearby Homes
- 28 Apthorp St
- 27 Herbert Rd
- 135 E Squantum St
- 85 E Squantum St Unit 10
- 11 Gould St
- 297 Billings St
- 20 Ellington Rd
- 10 W Elm Ave
- 201 Billings St
- 17 Holmes St Unit 204
- 17 Holmes St Unit 2
- 17 Holmes St Unit 1
- 11 Cleaves St
- 10 Weston Ave Unit 322
- 39 Fayette St Unit 403
- 100 W Squantum St Unit 411
- 54 Safford St
- 9 Chick St
- 115 W Squantum St Unit 517
- 115 W Squantum St Unit 811
- 218 Billings Rd
- 218 - 220 Billings Rd
- 60 Marshall St
- 208 Billings Rd
- 222 Billings Rd
- 58 Marshall St
- 202 Billings Rd
- 224 Billings Rd Unit 224
- 57 Marshall St
- 54 Marshall St
- 9 Warwick St Unit 1
- 9 Warwick St
- 9 Warwick St Unit 3
- 9 Warwick St Unit 2
- 207 Billings Rd
- 198 Billings Rd
- 215 Billings Rd
- 17 Warwick St
- 53 Marshall St
- 228 Billings Rd
Your Personal Tour Guide
Ask me questions while you tour the home.