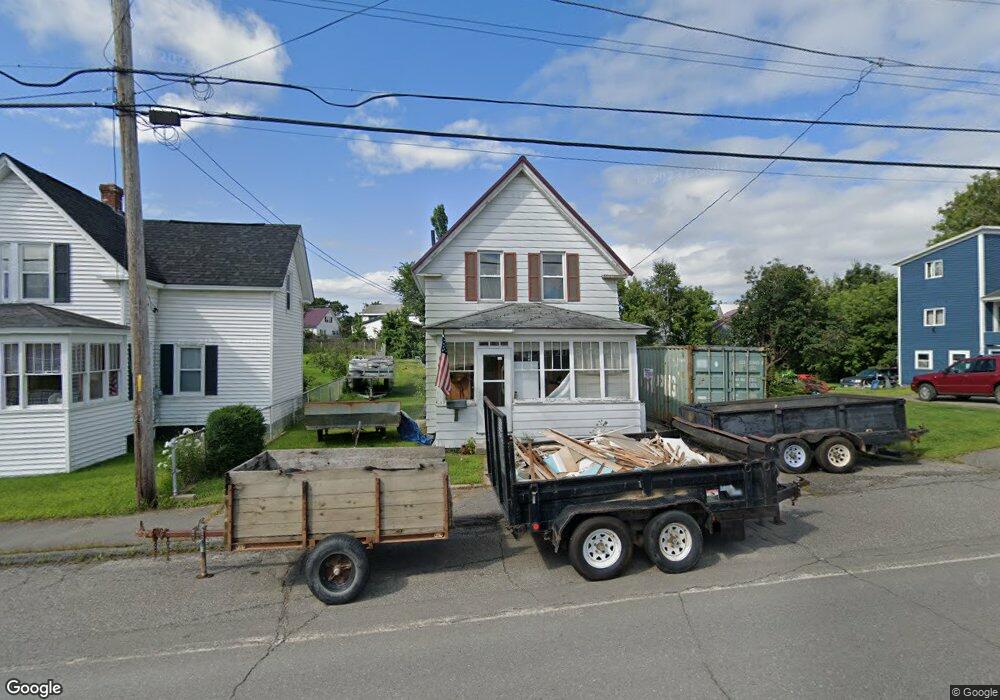
66 Medway Rd Millinocket, ME 04462
Estimated Value: $120,308 - $167,000
3
Beds
2
Baths
1,197
Sq Ft
$121/Sq Ft
Est. Value
About This Home
This home is located at 66 Medway Rd, Millinocket, ME 04462 and is currently estimated at $144,327, approximately $120 per square foot. 66 Medway Rd is a home located in Penobscot County with nearby schools including Granite Street School and Stearns Junior/Senior High School.
Ownership History
Date
Name
Owned For
Owner Type
Purchase Details
Closed on
Apr 6, 2009
Sold by
Ippoliti Jude N and Ippoliti Linda M
Bought by
Allen Justin R and Jacobs Virginia K
Current Estimated Value
Home Financials for this Owner
Home Financials are based on the most recent Mortgage that was taken out on this home.
Original Mortgage
$43,200
Outstanding Balance
$27,044
Interest Rate
4.92%
Mortgage Type
Unknown
Estimated Equity
$117,283
Create a Home Valuation Report for This Property
The Home Valuation Report is an in-depth analysis detailing your home's value as well as a comparison with similar homes in the area
Home Values in the Area
Average Home Value in this Area
Purchase History
| Date | Buyer | Sale Price | Title Company |
|---|---|---|---|
| Allen Justin R | -- | -- |
Source: Public Records
Mortgage History
| Date | Status | Borrower | Loan Amount |
|---|---|---|---|
| Open | Allen Justin R | $43,200 |
Source: Public Records
Tax History
| Year | Tax Paid | Tax Assessment Tax Assessment Total Assessment is a certain percentage of the fair market value that is determined by local assessors to be the total taxable value of land and additions on the property. | Land | Improvement |
|---|---|---|---|---|
| 2025 | $1,815 | $78,900 | $10,000 | $68,900 |
| 2024 | $1,777 | $64,400 | $5,000 | $59,400 |
| 2023 | $1,481 | $52,500 | $5,000 | $47,500 |
| 2022 | $1,387 | $47,000 | $5,000 | $42,000 |
| 2021 | $1,404 | $43,200 | $5,000 | $38,200 |
| 2020 | $1,394 | $41,000 | $5,000 | $36,000 |
| 2019 | $1,353 | $41,000 | $5,000 | $36,000 |
| 2018 | $1,333 | $41,000 | $5,000 | $36,000 |
| 2017 | $1,324 | $41,000 | $5,000 | $36,000 |
| 2016 | $1,283 | $41,000 | $5,000 | $36,000 |
| 2015 | $1,216 | $41,000 | $5,000 | $36,000 |
| 2014 | $1,214 | $41,000 | $5,000 | $36,000 |
Source: Public Records
Map
Nearby Homes
Your Personal Tour Guide
Ask me questions while you tour the home.