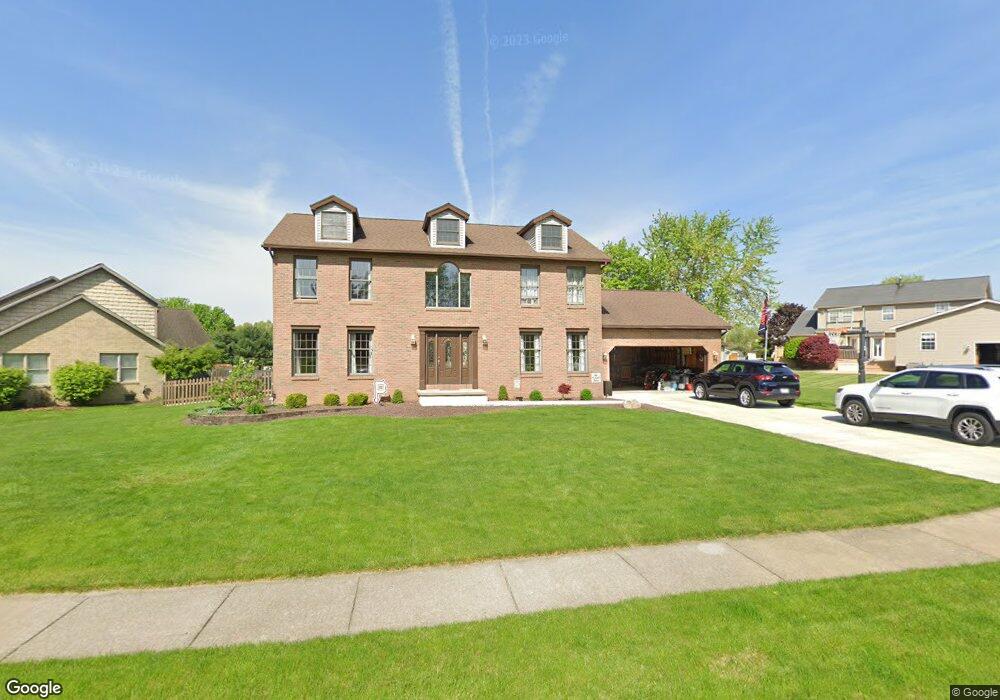
66 Mohawk Dr Girard, OH 44420
Estimated Value: $294,956 - $452,000
3
Beds
3
Baths
2,272
Sq Ft
$155/Sq Ft
Est. Value
About This Home
This home is located at 66 Mohawk Dr, Girard, OH 44420 and is currently estimated at $352,239, approximately $155 per square foot. 66 Mohawk Dr is a home located in Trumbull County with nearby schools including Girard Intermediate School, Prospect Elementary School, and Girard Junior High School.
Ownership History
Date
Name
Owned For
Owner Type
Purchase Details
Closed on
Sep 17, 2010
Sold by
Spain Mark Alan
Bought by
Wolfgang Michael E and Wolfgang Mary F
Current Estimated Value
Home Financials for this Owner
Home Financials are based on the most recent Mortgage that was taken out on this home.
Original Mortgage
$150,000
Outstanding Balance
$97,387
Interest Rate
4.42%
Mortgage Type
New Conventional
Estimated Equity
$254,852
Purchase Details
Closed on
Aug 7, 2008
Sold by
Spain Valerie Ann
Bought by
Spain Mark Alan
Purchase Details
Closed on
Jun 25, 1996
Sold by
Yorktown Homes Inc
Bought by
Spain Mark A and Spain Valerie A
Home Financials for this Owner
Home Financials are based on the most recent Mortgage that was taken out on this home.
Original Mortgage
$120,000
Interest Rate
6.38%
Mortgage Type
New Conventional
Purchase Details
Closed on
Mar 13, 1996
Sold by
Simon Sara L
Bought by
Yorktown Homes Inc
Purchase Details
Closed on
May 18, 1994
Bought by
Sara Lee Simon
Create a Home Valuation Report for This Property
The Home Valuation Report is an in-depth analysis detailing your home's value as well as a comparison with similar homes in the area
Home Values in the Area
Average Home Value in this Area
Purchase History
| Date | Buyer | Sale Price | Title Company |
|---|---|---|---|
| Wolfgang Michael E | $187,500 | Barristers Of Oh | |
| Spain Mark Alan | -- | Attorney | |
| Spain Mark A | $152,862 | -- | |
| Yorktown Homes Inc | $23,000 | -- | |
| Sara Lee Simon | -- | -- |
Source: Public Records
Mortgage History
| Date | Status | Borrower | Loan Amount |
|---|---|---|---|
| Open | Wolfgang Michael E | $150,000 | |
| Previous Owner | Spain Mark A | $120,000 |
Source: Public Records
Tax History
| Year | Tax Paid | Tax Assessment Tax Assessment Total Assessment is a certain percentage of the fair market value that is determined by local assessors to be the total taxable value of land and additions on the property. | Land | Improvement |
|---|---|---|---|---|
| 2024 | $3,184 | $77,980 | $10,500 | $67,480 |
| 2023 | $3,231 | $77,980 | $10,500 | $67,480 |
| 2022 | $3,339 | $63,880 | $10,500 | $53,380 |
| 2021 | $3,350 | $63,880 | $10,500 | $53,380 |
| 2020 | $3,394 | $63,880 | $10,500 | $53,380 |
| 2019 | $3,588 | $63,880 | $10,500 | $53,380 |
| 2018 | $3,761 | $63,880 | $10,500 | $53,380 |
| 2017 | $3,747 | $63,880 | $10,500 | $53,380 |
| 2016 | $3,747 | $61,530 | $10,500 | $51,030 |
| 2015 | $3,705 | $61,530 | $10,500 | $51,030 |
| 2014 | $3,704 | $61,530 | $10,500 | $51,030 |
| 2013 | $3,635 | $61,530 | $10,500 | $51,030 |
Source: Public Records
Map
Nearby Homes
- 644 Goist Ln
- 545 Thomas Ln
- 9 Hillside Dr
- 1120 Tibbetts Wick Rd
- 1850 Oriel Rogers Rd
- 1180 Keefer Rd
- 114 Townsend Ave
- 0 Naylor Lloyd Rd Unit 5066608
- 126 Churchill Rd
- 445 Powers Ave
- 36 Churchill Rd
- 111 Churchill Rd
- 0 Tibbetts Wick Unit 5175239
- 620 Washington Ave
- 100 Gordon St
- 1094 Churchill Rd
- 500 Forsythe Ave
- 1417 Sunny Dr
- 349 Forsythe Ave
- 417 Otis Ct SE
Your Personal Tour Guide
Ask me questions while you tour the home.