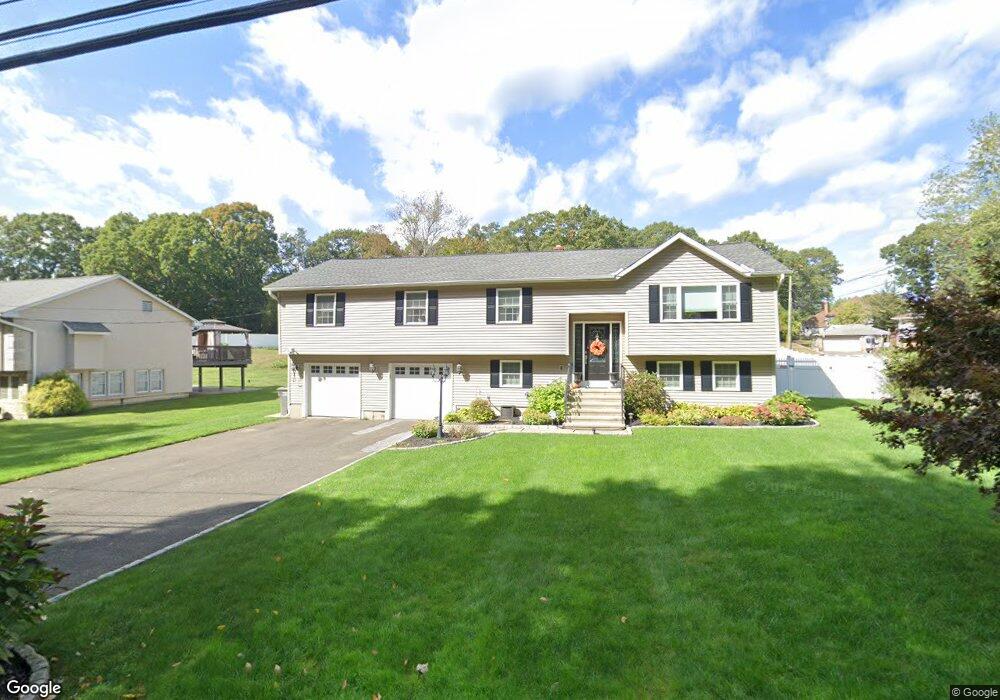
66 Mulberry St Naugatuck, CT 06770
Estimated Value: $407,000 - $502,000
4
Beds
3
Baths
2,146
Sq Ft
$212/Sq Ft
Est. Value
About This Home
This home is located at 66 Mulberry St, Naugatuck, CT 06770 and is currently estimated at $454,387, approximately $211 per square foot. 66 Mulberry St is a home located in New Haven County with nearby schools including City Hill Middle School and Naugatuck High School.
Ownership History
Date
Name
Owned For
Owner Type
Purchase Details
Closed on
Sep 1, 2016
Sold by
Piech Alexander and Piech Sarah
Bought by
Silva Jose and Silva Melissa
Current Estimated Value
Home Financials for this Owner
Home Financials are based on the most recent Mortgage that was taken out on this home.
Original Mortgage
$250,381
Outstanding Balance
$200,123
Interest Rate
3.45%
Mortgage Type
FHA
Estimated Equity
$245,513
Purchase Details
Closed on
Jan 7, 2013
Sold by
Piech 3Rd Alexander
Bought by
Piech Sarah and Piech Alexander
Home Financials for this Owner
Home Financials are based on the most recent Mortgage that was taken out on this home.
Original Mortgage
$55,000
Interest Rate
3.35%
Purchase Details
Closed on
Oct 18, 2012
Sold by
919 Investments Llc
Bought by
Piech 3Rd Alexander
Purchase Details
Closed on
Oct 11, 2011
Sold by
Us Bank Na
Bought by
919 Investments Llc
Purchase Details
Closed on
Aug 18, 2010
Sold by
Steve Michael
Bought by
Us Bk
Purchase Details
Closed on
Jun 8, 2006
Sold by
Hess Robert and Hess Nancy
Bought by
Steve Michael
Purchase Details
Closed on
Aug 1, 2000
Sold by
Domizio Josephine
Bought by
Hess Nancy
Create a Home Valuation Report for This Property
The Home Valuation Report is an in-depth analysis detailing your home's value as well as a comparison with similar homes in the area
Home Values in the Area
Average Home Value in this Area
Purchase History
| Date | Buyer | Sale Price | Title Company |
|---|---|---|---|
| Silva Jose | $255,000 | -- | |
| Piech Sarah | -- | -- | |
| Piech 3Rd Alexander | -- | -- | |
| 919 Investments Llc | -- | -- | |
| Us Bk | -- | -- | |
| Steve Michael | $305,000 | -- | |
| Hess Nancy | $174,000 | -- |
Source: Public Records
Mortgage History
| Date | Status | Borrower | Loan Amount |
|---|---|---|---|
| Open | Hess Nancy | $250,381 | |
| Previous Owner | Hess Nancy | $55,000 |
Source: Public Records
Tax History Compared to Growth
Tax History
| Year | Tax Paid | Tax Assessment Tax Assessment Total Assessment is a certain percentage of the fair market value that is determined by local assessors to be the total taxable value of land and additions on the property. | Land | Improvement |
|---|---|---|---|---|
| 2025 | $9,161 | $230,230 | $34,930 | $195,300 |
| 2024 | $9,621 | $230,230 | $34,930 | $195,300 |
| 2023 | $10,303 | $230,230 | $34,930 | $195,300 |
| 2022 | $8,283 | $173,470 | $36,870 | $136,600 |
| 2021 | $8,283 | $173,470 | $36,870 | $136,600 |
| 2020 | $8,283 | $173,470 | $36,870 | $136,600 |
| 2019 | $8,196 | $173,470 | $36,870 | $136,600 |
| 2018 | $7,678 | $158,810 | $47,150 | $111,660 |
| 2017 | $7,710 | $158,810 | $47,150 | $111,660 |
| 2016 | $7,570 | $158,810 | $47,150 | $111,660 |
| 2015 | $7,237 | $158,810 | $47,150 | $111,660 |
| 2014 | $7,156 | $158,810 | $47,150 | $111,660 |
| 2012 | $6,517 | $194,260 | $56,260 | $138,000 |
Source: Public Records
Map
Nearby Homes
- 58 Mulberry St
- 74 Mulberry St
- 68 Mulberry St
- 54 Mulberry St
- 72 Mulberry St
- 52 Mulberry St
- 78 Mulberry St
- 48 Mulberry St
- 49 Mulberry St
- 44 Tracey Ann Ct
- 38 Tracey Ann Ct
- 48 Tracey Ann Ct
- 84 Mulberry St
- 41 Mulberry St
- 32 Tracey Ann Ct
- 42 Mulberry St
- 52 Tracey Ann Ct
- 28 Tracey Ann Ct
- 88 Mulberry St
- 24 Tracey Ann Ct