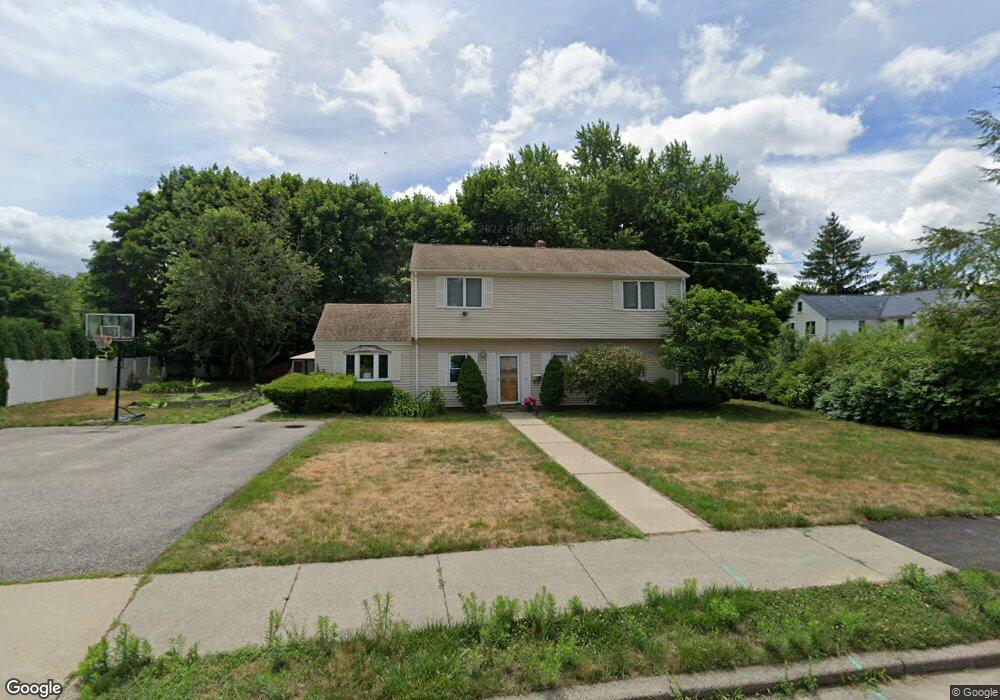
66 Myerson Ln Newton Center, MA 02459
Mount Ida NeighborhoodEstimated Value: $1,216,000 - $1,811,000
4
Beds
2
Baths
2,052
Sq Ft
$678/Sq Ft
Est. Value
About This Home
This home is located at 66 Myerson Ln, Newton Center, MA 02459 and is currently estimated at $1,390,615, approximately $677 per square foot. 66 Myerson Ln is a home located in Middlesex County with nearby schools including Memorial Spaulding Elementary School, Oak Hill Middle School, and Newton South High School.
Ownership History
Date
Name
Owned For
Owner Type
Purchase Details
Closed on
Apr 17, 2018
Sold by
Manzoli Marilyn
Bought by
Sunshine Rt
Current Estimated Value
Purchase Details
Closed on
Apr 5, 2001
Sold by
Manzoli Marilyn and Koritsky Toby
Bought by
Manzoli Marilyn
Create a Home Valuation Report for This Property
The Home Valuation Report is an in-depth analysis detailing your home's value as well as a comparison with similar homes in the area
Home Values in the Area
Average Home Value in this Area
Purchase History
| Date | Buyer | Sale Price | Title Company |
|---|---|---|---|
| Sunshine Rt | -- | -- | |
| Manzoli Marilyn | $150,000 | -- |
Source: Public Records
Mortgage History
| Date | Status | Borrower | Loan Amount |
|---|---|---|---|
| Previous Owner | Manzoli Marilyn | $410,000 | |
| Previous Owner | Manzoli Marilyn | $410,000 |
Source: Public Records
Tax History Compared to Growth
Tax History
| Year | Tax Paid | Tax Assessment Tax Assessment Total Assessment is a certain percentage of the fair market value that is determined by local assessors to be the total taxable value of land and additions on the property. | Land | Improvement |
|---|---|---|---|---|
| 2025 | $9,390 | $958,200 | $749,800 | $208,400 |
| 2024 | $9,080 | $930,300 | $728,000 | $202,300 |
| 2023 | $8,523 | $837,200 | $556,300 | $280,900 |
| 2022 | $8,155 | $775,200 | $515,100 | $260,100 |
| 2021 | $7,869 | $731,300 | $485,900 | $245,400 |
| 2020 | $7,635 | $731,300 | $485,900 | $245,400 |
| 2019 | $7,420 | $710,000 | $471,700 | $238,300 |
| 2018 | $7,075 | $653,900 | $426,400 | $227,500 |
| 2017 | $6,860 | $616,900 | $402,300 | $214,600 |
| 2016 | $6,561 | $576,500 | $376,000 | $200,500 |
| 2015 | $6,255 | $538,800 | $351,400 | $187,400 |
Source: Public Records
Map
Nearby Homes
- 853 Dedham St
- 22 Nightingale Path
- 544 Saw Mill Brook Pkwy
- 30 Esty Farm Rd
- 133 Oak Hill St
- 5 Kappius Path
- 141 Spiers Rd
- 36 Ober Rd
- 21 Lovett Rd
- 44 Lovett Rd
- 579 Baker St Unit 579
- 1307 Lagrange St Unit 1307
- 210 Nahanton St Unit 404
- 931 Lagrange St
- 135 Hartman Rd
- 139 Newfield St
- 63 Drumlin Rd
- 865 Lagrange St Unit 5
- 207 Nahanton St Unit 207
- 845 Lagrange St Unit 4