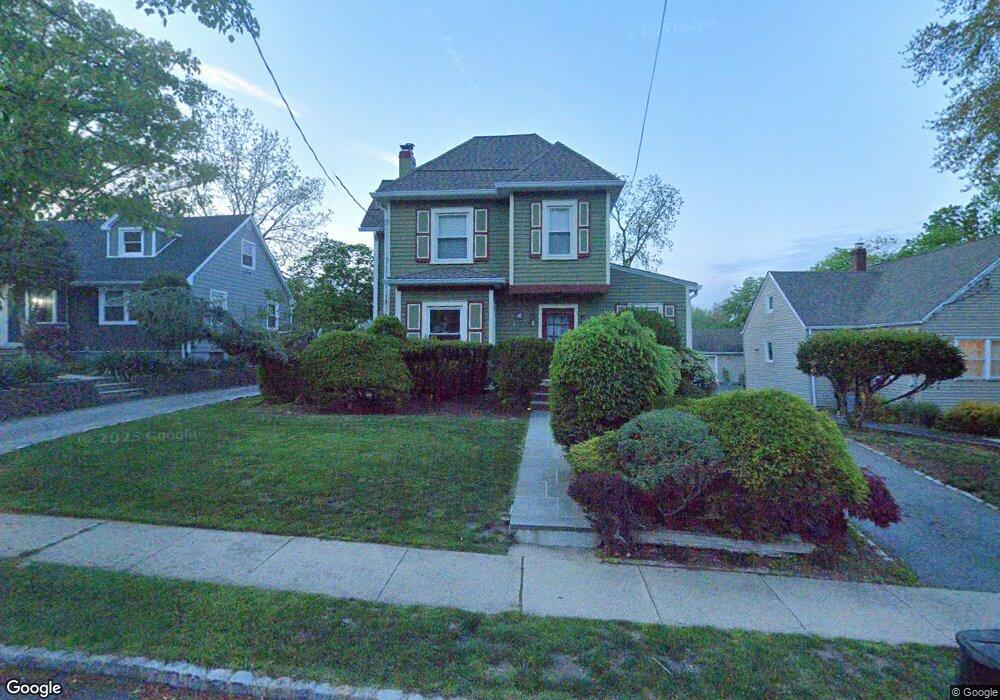
66 Myrtle Ave Cedar Grove, NJ 07009
Estimated Value: $700,000 - $784,282
--
Bed
--
Bath
1,951
Sq Ft
$389/Sq Ft
Est. Value
About This Home
This home is located at 66 Myrtle Ave, Cedar Grove, NJ 07009 and is currently estimated at $759,821, approximately $389 per square foot. 66 Myrtle Ave is a home located in Essex County with nearby schools including Cedar Grove High School and St Catherine Of Siena School.
Ownership History
Date
Name
Owned For
Owner Type
Purchase Details
Closed on
Jan 12, 2024
Sold by
Schiavo Michael J and Schiavo Alberta G
Bought by
Nguyen Dao and Nguyen Mandy Lau
Current Estimated Value
Home Financials for this Owner
Home Financials are based on the most recent Mortgage that was taken out on this home.
Original Mortgage
$540,000
Interest Rate
6.63%
Mortgage Type
New Conventional
Purchase Details
Closed on
Jul 1, 1992
Sold by
Gussoff Jeffrey and Gussoff Deborah
Bought by
Schiavo Michael and Schiavo Alberto
Create a Home Valuation Report for This Property
The Home Valuation Report is an in-depth analysis detailing your home's value as well as a comparison with similar homes in the area
Home Values in the Area
Average Home Value in this Area
Purchase History
| Date | Buyer | Sale Price | Title Company |
|---|---|---|---|
| Nguyen Dao | $720,000 | Realsafe Title | |
| Schiavo Michael | $235,000 | -- |
Source: Public Records
Mortgage History
| Date | Status | Borrower | Loan Amount |
|---|---|---|---|
| Previous Owner | Nguyen Dao | $540,000 |
Source: Public Records
Tax History Compared to Growth
Tax History
| Year | Tax Paid | Tax Assessment Tax Assessment Total Assessment is a certain percentage of the fair market value that is determined by local assessors to be the total taxable value of land and additions on the property. | Land | Improvement |
|---|---|---|---|---|
| 2025 | $11,680 | $468,600 | $237,700 | $230,900 |
| 2024 | $11,680 | $447,500 | $237,700 | $209,800 |
| 2022 | $11,474 | $447,500 | $237,700 | $209,800 |
| 2021 | $11,335 | $447,500 | $237,700 | $209,800 |
| 2020 | $11,501 | $447,500 | $237,700 | $209,800 |
| 2019 | $11,237 | $447,500 | $237,700 | $209,800 |
| 2018 | $10,722 | $447,500 | $237,700 | $209,800 |
| 2017 | $10,606 | $447,500 | $237,700 | $209,800 |
| 2016 | $10,279 | $447,500 | $237,700 | $209,800 |
| 2015 | $10,042 | $447,500 | $237,700 | $209,800 |
| 2014 | $9,836 | $447,500 | $237,700 | $209,800 |
Source: Public Records
Map
Nearby Homes