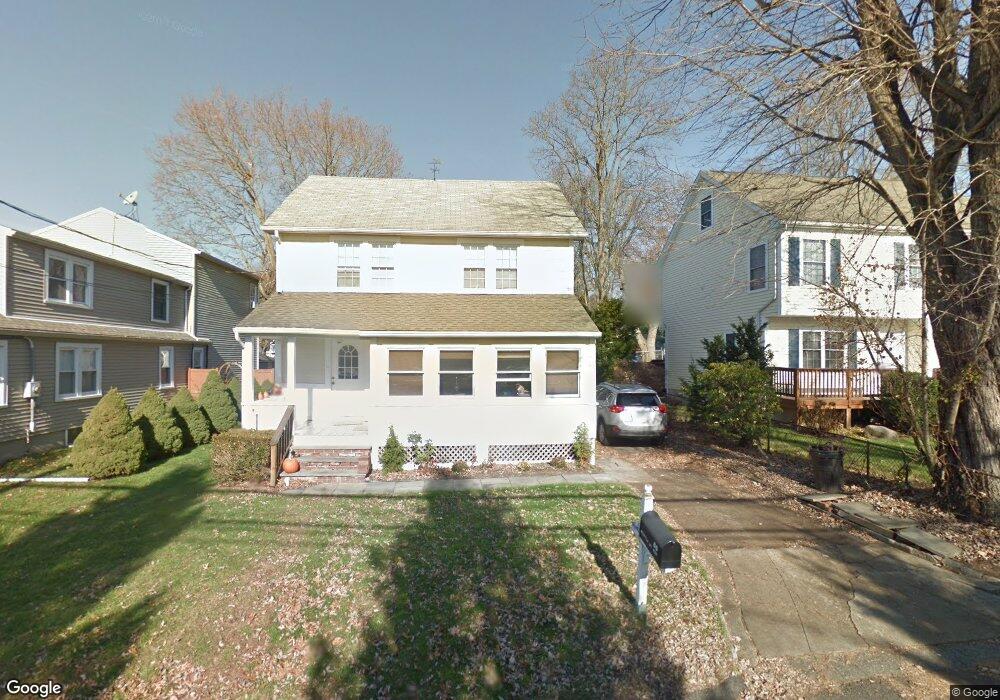
66 Myrtle Street Extension Norwalk, CT 06855
East Norwalk NeighborhoodEstimated Value: $672,000 - $858,000
4
Beds
2
Baths
1,845
Sq Ft
$409/Sq Ft
Est. Value
About This Home
This home is located at 66 Myrtle Street Extension, Norwalk, CT 06855 and is currently estimated at $753,787, approximately $408 per square foot. 66 Myrtle Street Extension is a home located in Fairfield County with nearby schools including Marvin Elementary School, Nathan Hale Middle School, and Norwalk High School.
Ownership History
Date
Name
Owned For
Owner Type
Purchase Details
Closed on
Apr 13, 2022
Sold by
Muro Joseph M
Bought by
Church Michael
Current Estimated Value
Home Financials for this Owner
Home Financials are based on the most recent Mortgage that was taken out on this home.
Original Mortgage
$450,500
Outstanding Balance
$419,374
Interest Rate
3.76%
Mortgage Type
Purchase Money Mortgage
Estimated Equity
$334,413
Purchase Details
Closed on
May 9, 2006
Sold by
Muro 2Nd Joseph A
Bought by
Muro Joseph M and Muro Janet M
Home Financials for this Owner
Home Financials are based on the most recent Mortgage that was taken out on this home.
Original Mortgage
$412,500
Interest Rate
6.34%
Mortgage Type
Purchase Money Mortgage
Purchase Details
Closed on
Dec 21, 1999
Sold by
Knadler Thomas G and Rusiecki Cynthia L
Bought by
Muro Jos A
Purchase Details
Closed on
Oct 19, 1989
Sold by
Tweedy Jonathan
Bought by
Rusiecki Cynthia
Create a Home Valuation Report for This Property
The Home Valuation Report is an in-depth analysis detailing your home's value as well as a comparison with similar homes in the area
Home Values in the Area
Average Home Value in this Area
Purchase History
| Date | Buyer | Sale Price | Title Company |
|---|---|---|---|
| Church Michael | $530,000 | None Available | |
| Church Michael | $530,000 | None Available | |
| Muro Joseph M | $555,000 | -- | |
| Muro Joseph M | $555,000 | -- | |
| Muro Jos A | $250,000 | -- | |
| Muro Jos A | $250,000 | -- | |
| Rusiecki Cynthia | $234,800 | -- |
Source: Public Records
Mortgage History
| Date | Status | Borrower | Loan Amount |
|---|---|---|---|
| Open | Church Michael | $450,500 | |
| Closed | Church Michael | $450,500 | |
| Previous Owner | Rusiecki Cynthia | $385,500 | |
| Previous Owner | Rusiecki Cynthia | $412,500 |
Source: Public Records
Tax History Compared to Growth
Tax History
| Year | Tax Paid | Tax Assessment Tax Assessment Total Assessment is a certain percentage of the fair market value that is determined by local assessors to be the total taxable value of land and additions on the property. | Land | Improvement |
|---|---|---|---|---|
| 2025 | $10,794 | $451,620 | $176,020 | $275,600 |
| 2024 | $10,633 | $451,620 | $176,020 | $275,600 |
| 2023 | $8,585 | $342,240 | $136,520 | $205,720 |
| 2022 | $8,400 | $342,240 | $136,520 | $205,720 |
| 2021 | $8,202 | $342,240 | $136,520 | $205,720 |
| 2020 | $8,199 | $342,240 | $136,520 | $205,720 |
| 2019 | $7,979 | $342,240 | $136,520 | $205,720 |
| 2018 | $6,588 | $247,640 | $115,920 | $131,720 |
| 2017 | $6,360 | $247,640 | $115,920 | $131,720 |
| 2016 | $6,300 | $247,640 | $115,920 | $131,720 |
| 2015 | $6,283 | $247,640 | $115,920 | $131,720 |
| 2014 | $6,201 | $247,640 | $115,920 | $131,720 |
Source: Public Records
Map
Nearby Homes
- 14 Scofield Place
- 18 Roxbury Rd
- 189 East Ave
- 6 Willow St
- 14 Dairy Farm Rd
- 1 1/2 Colony Place
- 25 Dairy Farm Rd
- 26 Rowan St
- 12 Pine Hill Ave
- 16 Elton Ct
- 38 Gregory Blvd
- 142 East Ave Unit A103
- 142 East Ave Unit 403
- 142 East Ave Unit A304
- 144 East Ave Unit B404
- 142 East Ave Unit A102
- 162 Strawberry Hill Ave
- 281 East Ave
- 301 East Ave
- 17 Pleasant St
- 68 Myrtle Street Extension
- 64 Myrtle Street Extension
- 70 Myrtle Street Extension
- 62 Myrtle Street Extension
- 14 Saxon Rd
- 72 Myrtle Street Extension
- 60 Myrtle Street Extension
- 16 Saxon Rd
- 12 Saxon Rd
- 20 Saxon Rd
- 74 Myrtle Street Extension
- 8 Saxon Rd
- 58 Myrtle Street Extension
- 22 Saxon Rd
- 76 Myrtle Street Extension
- 76 Myrtle Street Extension Unit 1ST F
- 56 Myrtle Street Extension
- 4 Saxon Rd
- 24 Saxon Rd
- 54 Myrtle Street Extension