Estimated Value: $363,586 - $429,000
3
Beds
2
Baths
2,765
Sq Ft
$142/Sq Ft
Est. Value
About This Home
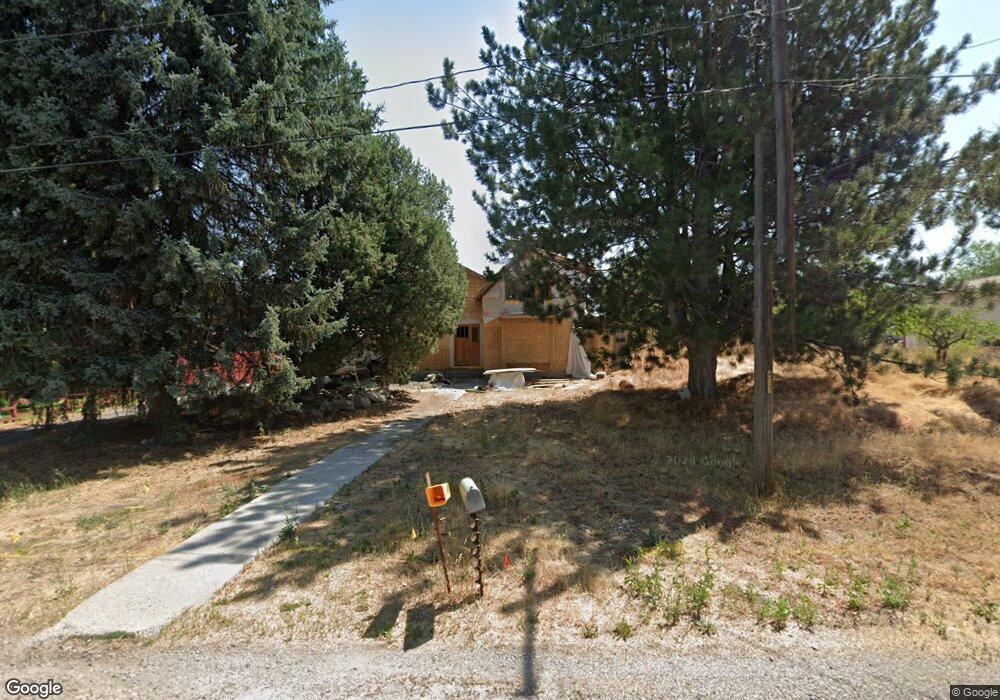
This home is located at 66 N 200 E, Hyrum, UT 84319 and is currently estimated at $393,647, approximately $142 per square foot. 66 N 200 E is a home located in Cache County with nearby schools including Lincoln School, South Cache Middle School, and Mountain Crest High School.
Ownership History
Date
Name
Owned For
Owner Type
Purchase Details
Closed on
May 8, 2021
Sold by
Gary And Gayle Wren Living Trust U/A and Wren Gary Endicott
Bought by
Wren John W
Current Estimated Value
Home Financials for this Owner
Home Financials are based on the most recent Mortgage that was taken out on this home.
Original Mortgage
$70,500
Outstanding Balance
$61,224
Interest Rate
1%
Mortgage Type
New Conventional
Estimated Equity
$332,423
Purchase Details
Closed on
Jan 13, 2015
Sold by
Wren Gary E and Wren Gayle Ann
Bought by
Wren Gary Endicott and Wren Gayle Ann
Purchase Details
Closed on
Sep 26, 2014
Sold by
Waechtler Hans Josef and Waechtler Peter George
Bought by
Wren Gary E and Wren Gayle
Home Financials for this Owner
Home Financials are based on the most recent Mortgage that was taken out on this home.
Original Mortgage
$87,375
Interest Rate
3.19%
Mortgage Type
New Conventional
Purchase Details
Closed on
Aug 29, 2008
Sold by
Waechtler Fritz A and Waechtler Emelie D
Bought by
Waechtler Fritz Albert and Waechtler Emelie D
Create a Home Valuation Report for This Property
The Home Valuation Report is an in-depth analysis detailing your home's value as well as a comparison with similar homes in the area
Home Values in the Area
Average Home Value in this Area
Purchase History
| Date | Buyer | Sale Price | Title Company |
|---|---|---|---|
| Wren John W | -- | Northern Title | |
| Wren Gary Endicott | -- | None Available | |
| Wren Gary E | -- | American Secure Title | |
| Waechtler Fritz Albert | -- | None Available |
Source: Public Records
Mortgage History
| Date | Status | Borrower | Loan Amount |
|---|---|---|---|
| Open | Wren John W | $70,500 | |
| Previous Owner | Wren Gary E | $87,375 |
Source: Public Records
Tax History
| Year | Tax Paid | Tax Assessment Tax Assessment Total Assessment is a certain percentage of the fair market value that is determined by local assessors to be the total taxable value of land and additions on the property. | Land | Improvement |
|---|---|---|---|---|
| 2025 | $1,150 | $165,080 | $0 | $0 |
| 2024 | $1,184 | $158,725 | $0 | $0 |
| 2023 | $859 | $110,090 | $0 | $0 |
| 2022 | $1,003 | $123,180 | $0 | $0 |
| 2021 | $983 | $180,985 | $83,600 | $97,385 |
| 2020 | $924 | $159,112 | $83,600 | $75,512 |
| 2019 | $864 | $141,423 | $65,911 | $75,512 |
| 2018 | $845 | $133,611 | $65,911 | $67,700 |
| 2017 | $836 | $70,055 | $0 | $0 |
| 2016 | $855 | $70,055 | $0 | $0 |
| 2015 | $857 | $70,055 | $0 | $0 |
| 2014 | $838 | $70,055 | $0 | $0 |
| 2013 | -- | $98,955 | $0 | $0 |
Source: Public Records
Map
Nearby Homes
Your Personal Tour Guide
Ask me questions while you tour the home.