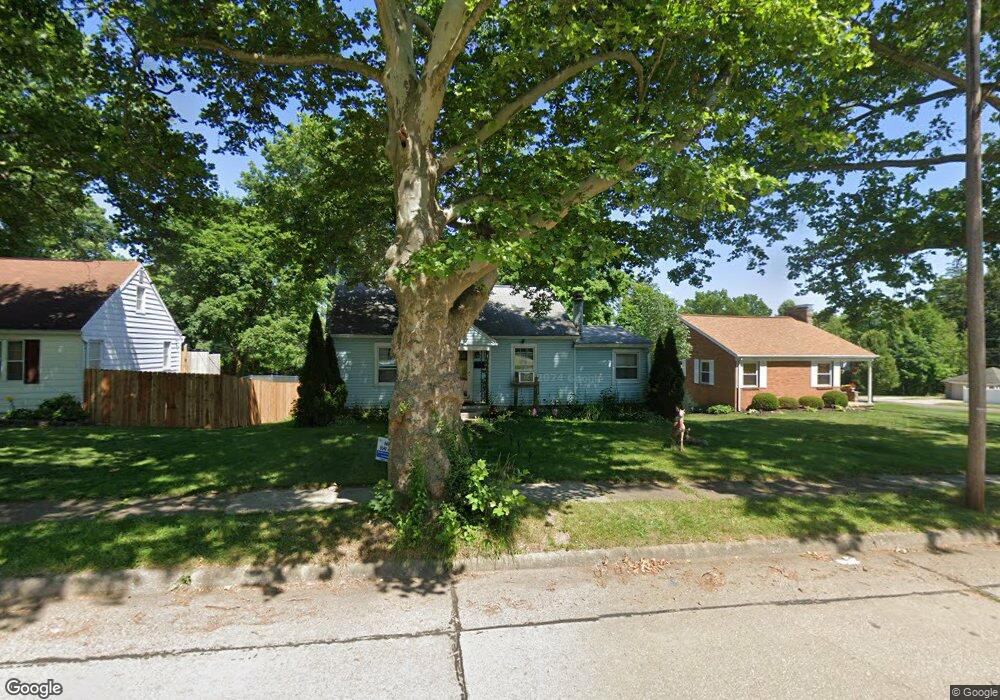
66 N 4th St Rittman, OH 44270
Estimated Value: $135,000 - $148,855
2
Beds
1
Bath
846
Sq Ft
$167/Sq Ft
Est. Value
About This Home
This home is located at 66 N 4th St, Rittman, OH 44270 and is currently estimated at $141,214, approximately $166 per square foot. 66 N 4th St is a home located in Wayne County with nearby schools including Rittman Elementary School, Rittman Middle School, and Rittman High School.
Ownership History
Date
Name
Owned For
Owner Type
Purchase Details
Closed on
Feb 2, 2023
Sold by
Woody Kaylene R and Thomas Frank
Bought by
Woodys Custom Carpentry Llc
Current Estimated Value
Purchase Details
Closed on
May 5, 2017
Sold by
Hopkins Jeffrey A
Bought by
Woody Kaylene R
Purchase Details
Closed on
Dec 20, 2006
Sold by
National Capital Properties Inc
Bought by
Hopkins Jeffrey A
Purchase Details
Closed on
Jun 16, 2000
Sold by
Shrout Joan L
Bought by
Madigan Cheryl
Home Financials for this Owner
Home Financials are based on the most recent Mortgage that was taken out on this home.
Original Mortgage
$63,200
Interest Rate
9.75%
Mortgage Type
New Conventional
Purchase Details
Closed on
Feb 15, 1990
Sold by
Kellogg Robert L
Bought by
Shrout Joan L
Purchase Details
Closed on
Jul 25, 1988
Sold by
Lunter Jeffrey A
Bought by
Kellogg Robert L
Create a Home Valuation Report for This Property
The Home Valuation Report is an in-depth analysis detailing your home's value as well as a comparison with similar homes in the area
Home Values in the Area
Average Home Value in this Area
Purchase History
| Date | Buyer | Sale Price | Title Company |
|---|---|---|---|
| Woodys Custom Carpentry Llc | $2,000 | -- | |
| Woody Kaylene R | $35,000 | None Available | |
| Hopkins Jeffrey A | $64,900 | First Security Title Corp | |
| Madigan Cheryl | $79,000 | -- | |
| Shrout Joan L | $47,000 | -- | |
| Kellogg Robert L | $43,500 | -- |
Source: Public Records
Mortgage History
| Date | Status | Borrower | Loan Amount |
|---|---|---|---|
| Previous Owner | Madigan Cheryl | $63,200 |
Source: Public Records
Tax History Compared to Growth
Tax History
| Year | Tax Paid | Tax Assessment Tax Assessment Total Assessment is a certain percentage of the fair market value that is determined by local assessors to be the total taxable value of land and additions on the property. | Land | Improvement |
|---|---|---|---|---|
| 2024 | $1,396 | $33,070 | $11,520 | $21,550 |
| 2023 | $1,396 | $33,070 | $11,520 | $21,550 |
| 2022 | $1,387 | $29,350 | $8,930 | $20,420 |
| 2021 | $1,410 | $29,350 | $8,930 | $20,420 |
| 2020 | $1,440 | $29,350 | $8,930 | $20,420 |
| 2019 | $1,421 | $27,630 | $8,740 | $18,890 |
| 2018 | $1,432 | $27,630 | $8,740 | $18,890 |
| 2017 | $1,405 | $27,630 | $8,740 | $18,890 |
| 2016 | $1,406 | $26,560 | $8,400 | $18,160 |
| 2015 | $1,676 | $26,560 | $8,400 | $18,160 |
| 2014 | $1,418 | $26,560 | $8,400 | $18,160 |
| 2013 | $1,474 | $27,070 | $11,090 | $15,980 |
Source: Public Records
Map
Nearby Homes