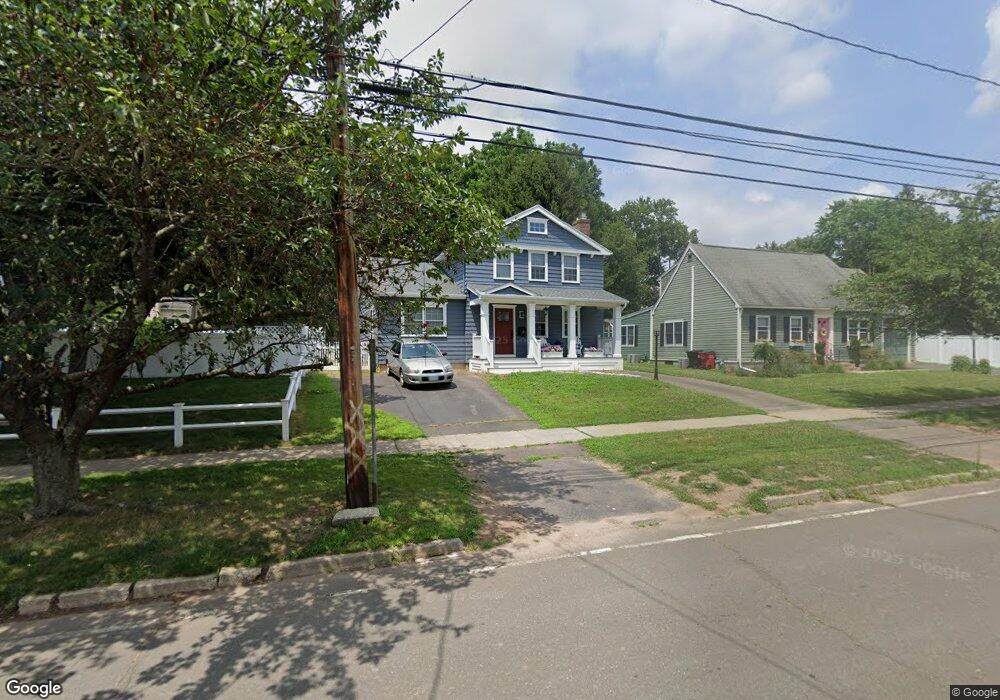
66 N Elm St Wallingford, CT 06492
Estimated Value: $388,000 - $465,572
3
Beds
2
Baths
1,812
Sq Ft
$235/Sq Ft
Est. Value
About This Home
This home is located at 66 N Elm St, Wallingford, CT 06492 and is currently estimated at $425,893, approximately $235 per square foot. 66 N Elm St is a home located in New Haven County with nearby schools including Moses Y Beach Elementary School, Rock Hill Elementary School, and Dag Hammarskjold Middle School.
Ownership History
Date
Name
Owned For
Owner Type
Purchase Details
Closed on
Dec 19, 2024
Sold by
Farrell Ann M and Zmijewski Mark
Bought by
Farrell Ann M and Zmijewski Mark
Current Estimated Value
Purchase Details
Closed on
Sep 10, 2024
Sold by
Golding Wilford F and Golding Phyllis A
Bought by
Farrell Ann M and Zmijewski Mark
Purchase Details
Closed on
Jul 18, 1980
Bought by
Golding Wilford F and Golding Phyllis A
Create a Home Valuation Report for This Property
The Home Valuation Report is an in-depth analysis detailing your home's value as well as a comparison with similar homes in the area
Home Values in the Area
Average Home Value in this Area
Purchase History
| Date | Buyer | Sale Price | Title Company |
|---|---|---|---|
| Farrell Ann M | -- | None Available | |
| Farrell Ann M | -- | None Available | |
| Farrell Ann M | $350,000 | None Available | |
| Farrell Ann M | $350,000 | None Available | |
| Golding Wilford F | -- | -- |
Source: Public Records
Mortgage History
| Date | Status | Borrower | Loan Amount |
|---|---|---|---|
| Previous Owner | Golding Wilford F | $123,917 | |
| Previous Owner | Golding Wilford F | $118,000 |
Source: Public Records
Tax History
| Year | Tax Paid | Tax Assessment Tax Assessment Total Assessment is a certain percentage of the fair market value that is determined by local assessors to be the total taxable value of land and additions on the property. | Land | Improvement |
|---|---|---|---|---|
| 2025 | $6,332 | $262,500 | $93,100 | $169,400 |
| 2024 | $6,169 | $201,200 | $82,100 | $119,100 |
| 2023 | $5,903 | $201,200 | $82,100 | $119,100 |
| 2022 | $5,843 | $201,200 | $82,100 | $119,100 |
| 2021 | $5,738 | $201,200 | $82,100 | $119,100 |
| 2020 | $5,806 | $198,900 | $87,400 | $111,500 |
| 2019 | $5,806 | $198,900 | $87,400 | $111,500 |
| 2018 | $5,696 | $198,900 | $87,400 | $111,500 |
| 2017 | $5,679 | $198,900 | $87,400 | $111,500 |
| 2016 | $5,547 | $198,900 | $87,400 | $111,500 |
| 2015 | $5,576 | $203,000 | $87,400 | $115,600 |
| 2014 | $5,459 | $203,000 | $87,400 | $115,600 |
Source: Public Records
Map
Nearby Homes
- 85 N Colony St
- 46 Walnut Ln
- 42 S Cherry St Unit 238
- 120 S Cherry St
- 570 N Main St
- 71 Cedar Ln
- 1 Dean Dr
- 90 Masonic Ave
- 30 Clinton Place
- 5 Kish Place
- 31 S Turnpike Rd Unit C2
- 69 Terrace Gardens
- 70 N Turnpike Rd Unit 21
- 57 Terrace Gardens Unit 57
- 61 Cheshire Rd
- 89 Saw Mill Dr
- 30 King St
- 230 Main St Unit 18
- 101 Grieb Rd
- 54 Parker Farms Rd
Your Personal Tour Guide
Ask me questions while you tour the home.