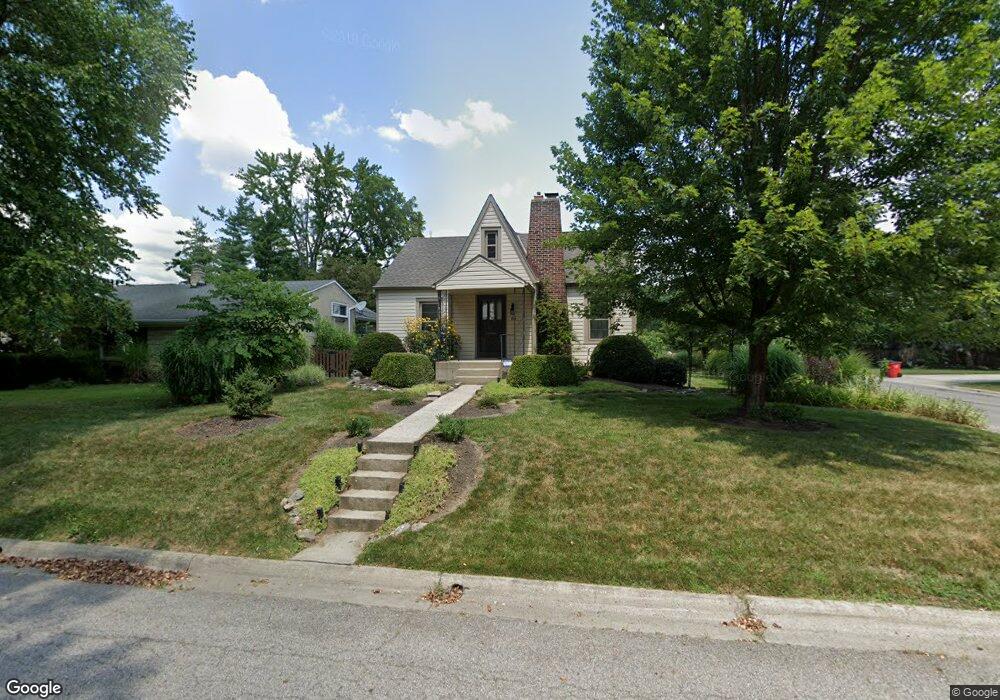
66 Orchard Dr Worthington, OH 43085
Estimated Value: $629,000 - $788,000
4
Beds
3
Baths
2,239
Sq Ft
$308/Sq Ft
Est. Value
About This Home
This home is located at 66 Orchard Dr, Worthington, OH 43085 and is currently estimated at $690,026, approximately $308 per square foot. 66 Orchard Dr is a home located in Franklin County with nearby schools including Colonial Hills Elementary School, Kilbourne Middle School, and Thomas Worthington High School.
Ownership History
Date
Name
Owned For
Owner Type
Purchase Details
Closed on
Jun 4, 2019
Sold by
Hitchcock Brian R and Deleon Terra L
Bought by
Collins Gregory S
Current Estimated Value
Home Financials for this Owner
Home Financials are based on the most recent Mortgage that was taken out on this home.
Original Mortgage
$450,000
Outstanding Balance
$396,454
Interest Rate
4.2%
Mortgage Type
New Conventional
Estimated Equity
$293,572
Purchase Details
Closed on
Apr 13, 2006
Sold by
Goodrich Cecil R and Goodrich Jane E
Bought by
Hitchcock Brian R and Deleon Terra L
Home Financials for this Owner
Home Financials are based on the most recent Mortgage that was taken out on this home.
Original Mortgage
$196,000
Interest Rate
6.34%
Mortgage Type
Fannie Mae Freddie Mac
Purchase Details
Closed on
Apr 9, 1968
Bought by
Goodrich Cecil R and Goodrich Jane E
Create a Home Valuation Report for This Property
The Home Valuation Report is an in-depth analysis detailing your home's value as well as a comparison with similar homes in the area
Home Values in the Area
Average Home Value in this Area
Purchase History
| Date | Buyer | Sale Price | Title Company |
|---|---|---|---|
| Collins Gregory S | $500,000 | Landsel Title Agency Inc | |
| Hitchcock Brian R | $245,000 | Talon Group | |
| Goodrich Cecil R | -- | -- |
Source: Public Records
Mortgage History
| Date | Status | Borrower | Loan Amount |
|---|---|---|---|
| Open | Collins Gregory S | $450,000 | |
| Previous Owner | Hitchcock Brian R | $196,000 |
Source: Public Records
Tax History Compared to Growth
Tax History
| Year | Tax Paid | Tax Assessment Tax Assessment Total Assessment is a certain percentage of the fair market value that is determined by local assessors to be the total taxable value of land and additions on the property. | Land | Improvement |
|---|---|---|---|---|
| 2024 | $10,772 | $169,750 | $41,090 | $128,660 |
| 2023 | $10,316 | $169,750 | $41,090 | $128,660 |
| 2022 | $10,414 | $136,920 | $22,540 | $114,380 |
| 2021 | $9,629 | $136,920 | $22,540 | $114,380 |
| 2020 | $9,285 | $136,920 | $22,540 | $114,380 |
| 2019 | $8,285 | $110,570 | $22,540 | $88,030 |
| 2018 | $7,408 | $110,570 | $22,540 | $88,030 |
| 2017 | $7,448 | $110,570 | $22,540 | $88,030 |
| 2016 | $6,782 | $92,820 | $27,230 | $65,590 |
| 2015 | $6,783 | $92,820 | $27,230 | $65,590 |
| 2014 | $6,780 | $92,820 | $27,230 | $65,590 |
| 2013 | $3,068 | $84,385 | $24,745 | $59,640 |
Source: Public Records
Map
Nearby Homes
- 5935 N High St Unit 221
- 5818 Crescent Ct
- 5778 Crescent Ct
- 123 W South St
- 264 E South St
- 262 W South St
- 285 Pinney Dr
- 686 Plymouth St
- 5584 Morning St
- 152 E Dublin Granville Rd
- 382 Park Blvd
- 153 Chase Rd
- 301 W Riverglen Dr
- 5542 Emerson Ave
- 365 Pinney Dr
- 292 Chase Rd
- 105 W Lincoln Ave
- 5508 Emerson Ave
- 512 Park Overlook Dr
- 503 Meadoway Park