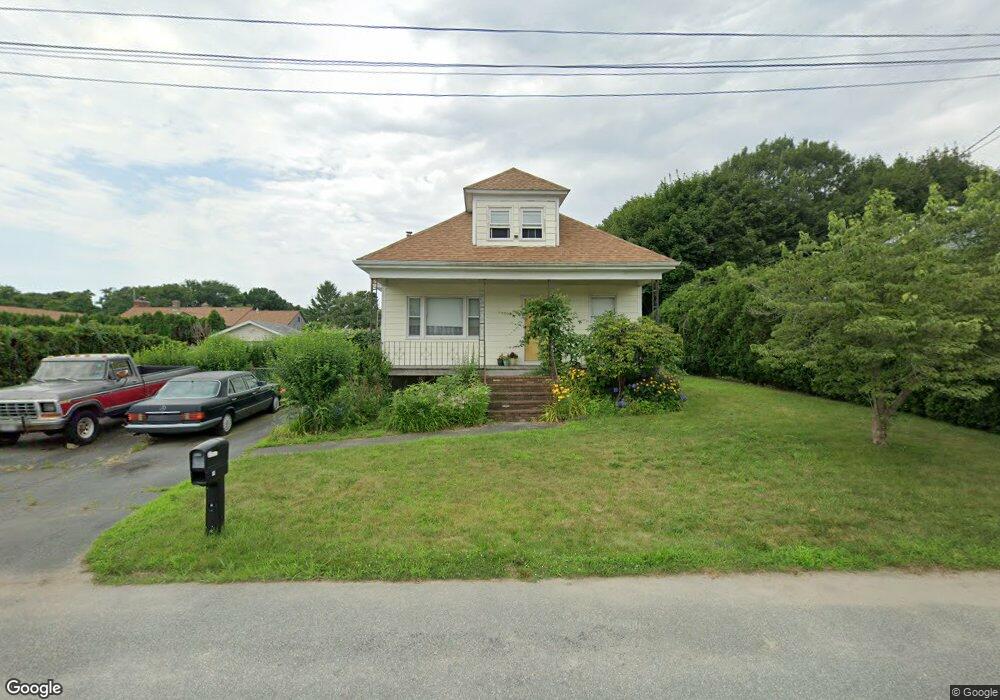
66 Osborne St New Bedford, MA 02740
The South End NeighborhoodEstimated Value: $442,802 - $519,000
3
Beds
1
Bath
1,414
Sq Ft
$335/Sq Ft
Est. Value
About This Home
This home is located at 66 Osborne St, New Bedford, MA 02740 and is currently estimated at $473,201, approximately $334 per square foot. 66 Osborne St is a home located in Bristol County with nearby schools including John B. DeValles Elementary School, Roosevelt Middle School, and New Bedford High School.
Ownership History
Date
Name
Owned For
Owner Type
Purchase Details
Closed on
Sep 2, 2021
Sold by
Silva Mary L
Bought by
66 Osborn Street Ft and Silva
Current Estimated Value
Purchase Details
Closed on
Mar 9, 2021
Sold by
Silva Jason O
Bought by
Silva Mary L
Purchase Details
Closed on
Oct 1, 2018
Sold by
Silva Roy and Silva Mary L
Bought by
66 Osborn Street Irt and Silva
Create a Home Valuation Report for This Property
The Home Valuation Report is an in-depth analysis detailing your home's value as well as a comparison with similar homes in the area
Home Values in the Area
Average Home Value in this Area
Purchase History
| Date | Buyer | Sale Price | Title Company |
|---|---|---|---|
| 66 Osborn Street Ft | -- | None Available | |
| 66 Osborn Street Ft | -- | None Available | |
| Silva Mary L | -- | None Available | |
| Silva Mary L | -- | None Available | |
| Silva Jason O | -- | None Available | |
| Silva Jason O | -- | None Available | |
| 66 Osborn Street Irt | -- | -- | |
| 66 Osborn Street Irt | -- | -- |
Source: Public Records
Tax History Compared to Growth
Tax History
| Year | Tax Paid | Tax Assessment Tax Assessment Total Assessment is a certain percentage of the fair market value that is determined by local assessors to be the total taxable value of land and additions on the property. | Land | Improvement |
|---|---|---|---|---|
| 2025 | $4,527 | $400,300 | $136,000 | $264,300 |
| 2024 | $4,331 | $360,900 | $128,100 | $232,800 |
| 2023 | $4,303 | $301,100 | $110,400 | $190,700 |
| 2022 | $3,977 | $255,900 | $100,500 | $155,400 |
| 2021 | $3,874 | $248,500 | $100,500 | $148,000 |
| 2020 | $3,962 | $245,200 | $100,500 | $144,700 |
| 2019 | $3,795 | $230,400 | $100,500 | $129,900 |
| 2018 | $3,649 | $219,400 | $100,500 | $118,900 |
| 2017 | $3,416 | $204,700 | $100,500 | $104,200 |
| 2016 | $3,234 | $196,100 | $96,600 | $99,500 |
| 2015 | $2,910 | $185,000 | $90,700 | $94,300 |
| 2014 | $2,647 | $174,600 | $90,700 | $83,900 |
Source: Public Records
Map
Nearby Homes