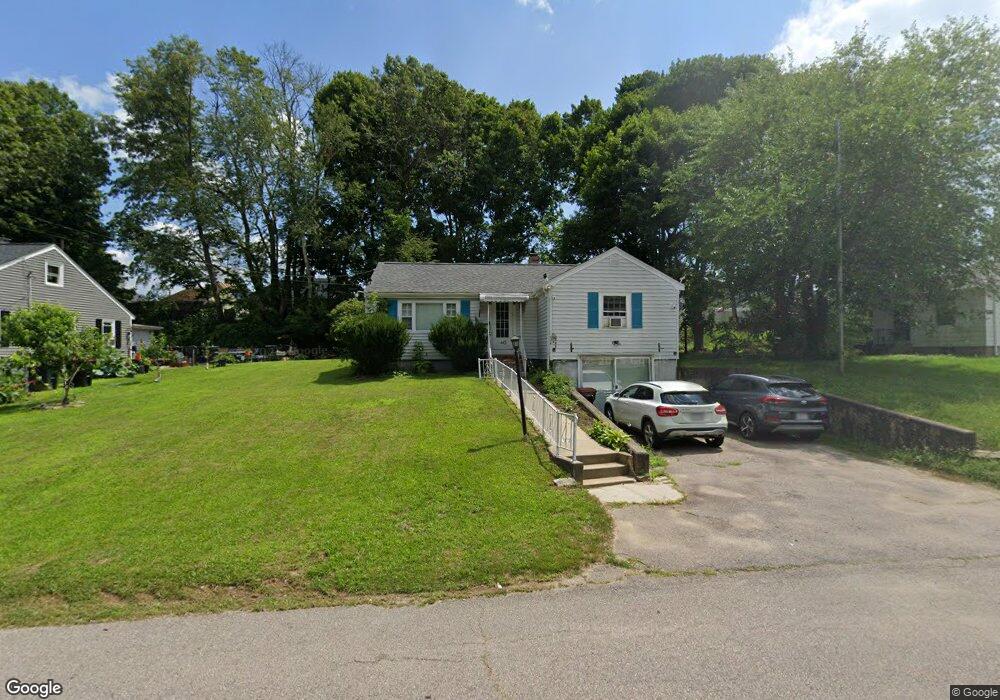
66 Packard Way Brockton, MA 02301
Clifton Heights NeighborhoodEstimated Value: $418,000 - $506,054
3
Beds
2
Baths
1,190
Sq Ft
$398/Sq Ft
Est. Value
About This Home
This home is located at 66 Packard Way, Brockton, MA 02301 and is currently estimated at $474,014, approximately $398 per square foot. 66 Packard Way is a home located in Plymouth County with nearby schools including John F. Kennedy Elementary School, Davis K-8 School, and South Middle School.
Ownership History
Date
Name
Owned For
Owner Type
Purchase Details
Closed on
Mar 5, 2013
Sold by
Khang Chou and Khang Fang L
Bought by
Khang Chou and Khang Fang L
Current Estimated Value
Purchase Details
Closed on
Apr 18, 2008
Sold by
Millett Rita F and Zonfrelli Joan M
Bought by
Khang Chou and Liang Fang
Home Financials for this Owner
Home Financials are based on the most recent Mortgage that was taken out on this home.
Original Mortgage
$137,000
Interest Rate
6.1%
Mortgage Type
Purchase Money Mortgage
Create a Home Valuation Report for This Property
The Home Valuation Report is an in-depth analysis detailing your home's value as well as a comparison with similar homes in the area
Home Values in the Area
Average Home Value in this Area
Purchase History
| Date | Buyer | Sale Price | Title Company |
|---|---|---|---|
| Khang Chou | -- | -- | |
| Khang Chou | $172,000 | -- | |
| Khang Chou | -- | -- | |
| Khang Chou | $172,000 | -- |
Source: Public Records
Mortgage History
| Date | Status | Borrower | Loan Amount |
|---|---|---|---|
| Previous Owner | Khang Chou | $137,000 |
Source: Public Records
Tax History Compared to Growth
Tax History
| Year | Tax Paid | Tax Assessment Tax Assessment Total Assessment is a certain percentage of the fair market value that is determined by local assessors to be the total taxable value of land and additions on the property. | Land | Improvement |
|---|---|---|---|---|
| 2025 | $4,766 | $393,600 | $140,400 | $253,200 |
| 2024 | $4,459 | $371,000 | $140,400 | $230,600 |
| 2023 | $4,437 | $341,800 | $105,900 | $235,900 |
| 2022 | $3,990 | $285,600 | $96,300 | $189,300 |
| 2021 | $3,872 | $267,000 | $80,300 | $186,700 |
| 2020 | $3,869 | $255,400 | $74,900 | $180,500 |
| 2019 | $3,524 | $226,800 | $72,900 | $153,900 |
| 2018 | $2,949 | $183,600 | $72,900 | $110,700 |
| 2017 | $2,842 | $176,500 | $72,900 | $103,600 |
| 2016 | $2,875 | $165,600 | $70,800 | $94,800 |
| 2015 | $2,655 | $146,300 | $70,800 | $75,500 |
| 2014 | $2,571 | $141,800 | $70,800 | $71,000 |
Source: Public Records
Map
Nearby Homes