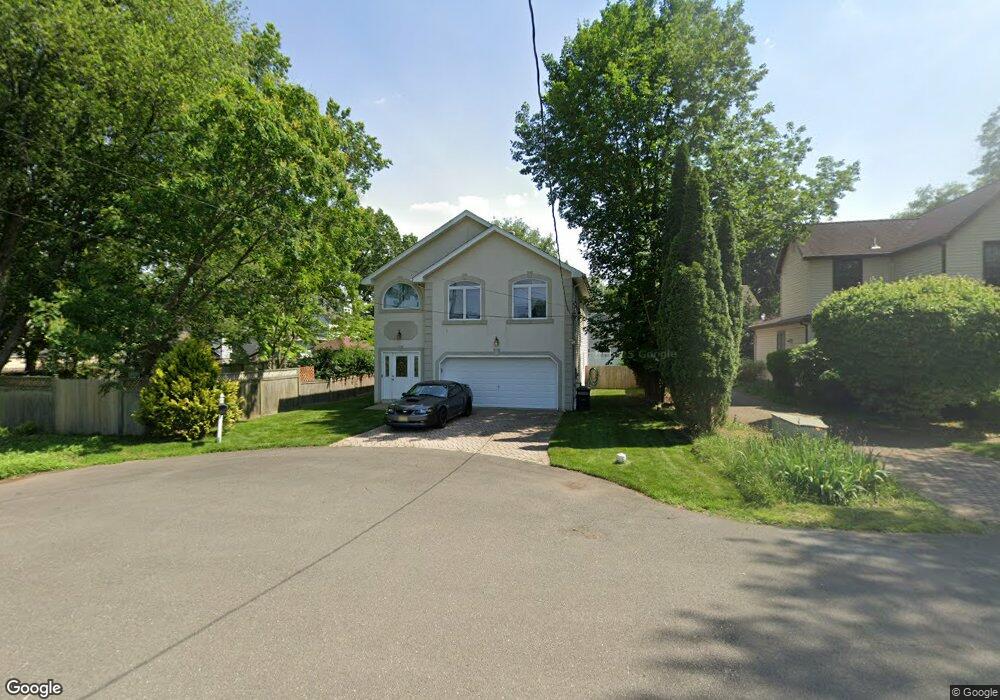
66 Prospect Ave Cresskill, NJ 07626
Estimated Value: $674,000 - $962,000
Studio
--
Bath
1,992
Sq Ft
$416/Sq Ft
Est. Value
About This Home
This home is located at 66 Prospect Ave, Cresskill, NJ 07626 and is currently estimated at $828,064, approximately $415 per square foot. 66 Prospect Ave is a home located in Bergen County with nearby schools including Cresskill High School, Spring School, and Lubavitch On The Palisades.
Ownership History
Date
Name
Owned For
Owner Type
Purchase Details
Closed on
Dec 20, 2017
Sold by
Moss Barry J
Bought by
Moss Lisa
Current Estimated Value
Purchase Details
Closed on
Jul 16, 2001
Sold by
15 Wakelee Drive Corp
Bought by
Moss Barry Jayson and Moss Lisa
Home Financials for this Owner
Home Financials are based on the most recent Mortgage that was taken out on this home.
Original Mortgage
$275,000
Interest Rate
6.66%
Purchase Details
Closed on
Jan 17, 2001
Sold by
Demartini Videlmina
Bought by
15 Wakelee Drive Corp
Create a Home Valuation Report for This Property
The Home Valuation Report is an in-depth analysis detailing your home's value as well as a comparison with similar homes in the area
Home Values in the Area
Average Home Value in this Area
Purchase History
| Date | Buyer | Sale Price | Title Company |
|---|---|---|---|
| Moss Lisa | -- | -- | |
| Moss Barry Jayson | $379,900 | -- | |
| 15 Wakelee Drive Corp | $62,000 | -- |
Source: Public Records
Mortgage History
| Date | Status | Borrower | Loan Amount |
|---|---|---|---|
| Previous Owner | Moss Barry Jayson | $275,000 |
Source: Public Records
Tax History
| Year | Tax Paid | Tax Assessment Tax Assessment Total Assessment is a certain percentage of the fair market value that is determined by local assessors to be the total taxable value of land and additions on the property. | Land | Improvement |
|---|---|---|---|---|
| 2025 | $12,427 | $579,900 | $285,900 | $294,000 |
| 2024 | $11,689 | $540,300 | $256,100 | $284,200 |
| 2023 | $11,344 | $503,600 | $226,100 | $277,500 |
| 2022 | $11,344 | $471,300 | $203,900 | $267,400 |
| 2021 | $10,977 | $449,500 | $189,000 | $260,500 |
| 2020 | $10,601 | $435,900 | $179,000 | $256,900 |
| 2019 | $10,345 | $429,800 | $176,500 | $253,300 |
| 2018 | $7,171 | $425,300 | $174,000 | $251,300 |
| 2017 | $11,378 | $418,000 | $156,500 | $261,500 |
| 2016 | $11,039 | $418,000 | $156,500 | $261,500 |
| 2015 | $10,697 | $418,000 | $156,500 | $261,500 |
| 2014 | $10,375 | $418,000 | $156,500 | $261,500 |
Source: Public Records
Map
Nearby Homes
Your Personal Tour Guide
Ask me questions while you tour the home.