Estimated Value: $397,000 - $407,000
4
Beds
1
Bath
2,134
Sq Ft
$188/Sq Ft
Est. Value
About This Home
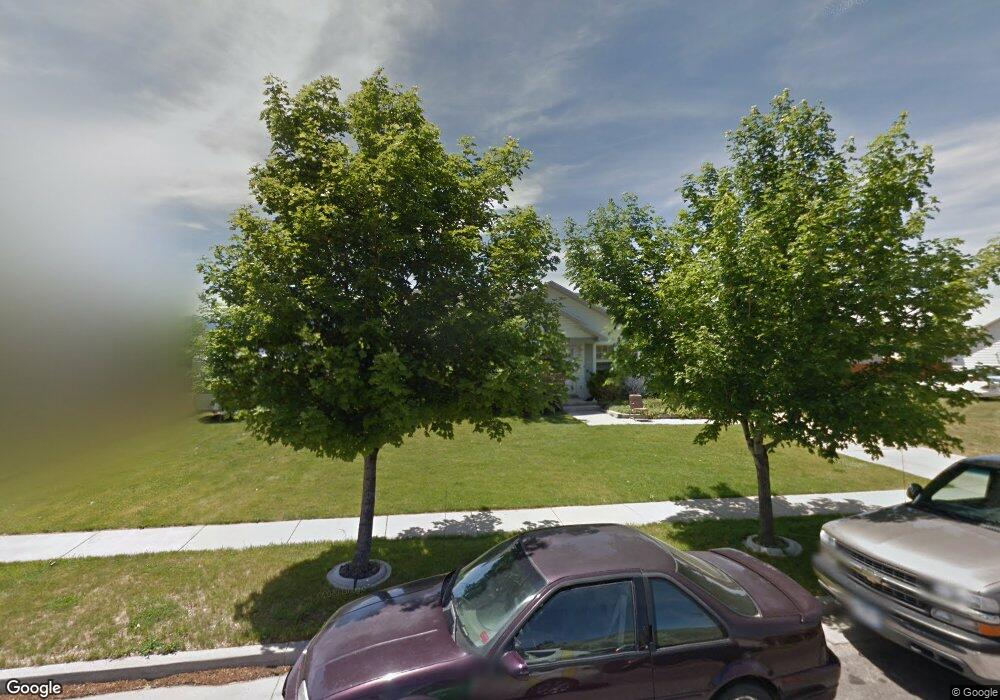
This home is located at 66 S 1250 E, Hyrum, UT 84319 and is currently estimated at $401,757, approximately $188 per square foot. 66 S 1250 E is a home located in Cache County with nearby schools including Canyon School, South Cache Middle School, and Mountain Crest High School.
Ownership History
Date
Name
Owned For
Owner Type
Purchase Details
Closed on
Dec 21, 2020
Sold by
Haslam Andrew and Haslam Brent
Bought by
Ward Nathan J and Ward Sherissa A
Current Estimated Value
Home Financials for this Owner
Home Financials are based on the most recent Mortgage that was taken out on this home.
Original Mortgage
$235,200
Outstanding Balance
$208,915
Interest Rate
2.7%
Mortgage Type
New Conventional
Estimated Equity
$192,842
Purchase Details
Closed on
Aug 5, 2016
Sold by
Christensen Joe G and Christensen Jessica
Bought by
Haslam Andrew and Haslam Brent
Purchase Details
Closed on
May 24, 2007
Sold by
Warnes Brody and Warnes Rebecca
Bought by
Christensen Joe G and Christensen Jessica
Home Financials for this Owner
Home Financials are based on the most recent Mortgage that was taken out on this home.
Original Mortgage
$6,363
Interest Rate
6.14%
Mortgage Type
Stand Alone Second
Purchase Details
Closed on
Apr 20, 2005
Sold by
The Secretary Of Housing & Urban Develop
Bought by
Warnes Brody and Warnes Rebecca
Home Financials for this Owner
Home Financials are based on the most recent Mortgage that was taken out on this home.
Original Mortgage
$106,500
Interest Rate
5.37%
Mortgage Type
New Conventional
Create a Home Valuation Report for This Property
The Home Valuation Report is an in-depth analysis detailing your home's value as well as a comparison with similar homes in the area
Home Values in the Area
Average Home Value in this Area
Purchase History
| Date | Buyer | Sale Price | Title Company |
|---|---|---|---|
| Ward Nathan J | -- | Cache Title Logan | |
| Haslam Andrew | -- | Hickman Land Title | |
| Christensen Joe G | -- | American Secure Title | |
| Warnes Brody | -- | Cache Title Company |
Source: Public Records
Mortgage History
| Date | Status | Borrower | Loan Amount |
|---|---|---|---|
| Open | Ward Nathan J | $235,200 | |
| Previous Owner | Christensen Joe G | $6,363 | |
| Previous Owner | Christensen Joe G | $137,837 | |
| Previous Owner | Warnes Brody | $106,500 |
Source: Public Records
Tax History
| Year | Tax Paid | Tax Assessment Tax Assessment Total Assessment is a certain percentage of the fair market value that is determined by local assessors to be the total taxable value of land and additions on the property. | Land | Improvement |
|---|---|---|---|---|
| 2025 | $1,506 | $216,175 | $0 | $0 |
| 2024 | $1,604 | $215,095 | $0 | $0 |
| 2023 | $1,723 | $220,910 | $0 | $0 |
| 2022 | $1,798 | $220,910 | $0 | $0 |
| 2021 | $1,766 | $334,325 | $65,000 | $269,325 |
| 2020 | $1,287 | $228,691 | $65,000 | $163,691 |
| 2019 | $1,219 | $203,691 | $40,000 | $163,691 |
| 2018 | $1,129 | $182,340 | $40,000 | $142,340 |
| 2017 | $1,112 | $93,170 | $0 | $0 |
| 2016 | $1,137 | $82,335 | $0 | $0 |
| 2015 | $918 | $75,060 | $0 | $0 |
| 2014 | $898 | $75,060 | $0 | $0 |
| 2013 | -- | $75,060 | $0 | $0 |
Source: Public Records
Map
Nearby Homes
Your Personal Tour Guide
Ask me questions while you tour the home.