

66 S Main St Berkley, MA 02779
Berkley Bridge/Lower Berkley NeighborhoodEstimated payment $4,508/month
Highlights
- 4.17 Acre Lot
- 1 Fireplace
- Porch
- Colonial Architecture
- No HOA
- Cooling Available
About This Home
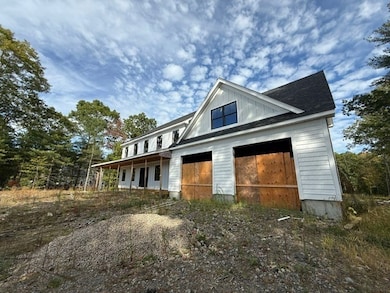
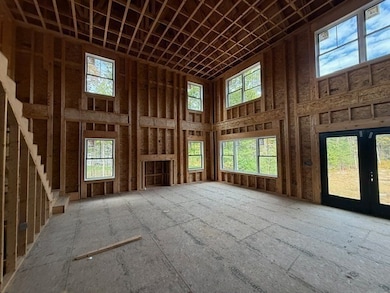
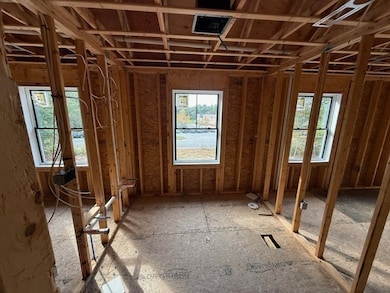
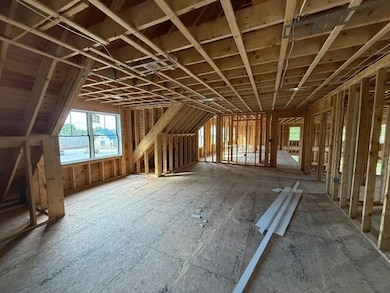
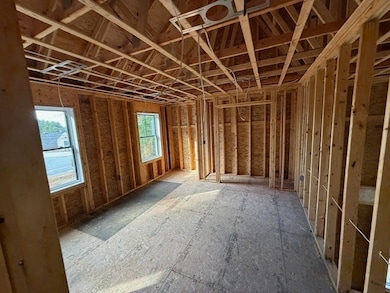
This is a fantastic opportunity to complete your own renovation or new construction project. Located in a desirable Berkley neighborhood, this weather-tight home offers a tasteful design, an open and inviting floor plan, and an expansive primary suite. With the septic system and well already installed, the groundwork is done—providing the perfect canvas to finish and customize this property exactly the way you envision it. Do not wait on this one.

Home Details
Home Type
- Single Family
Est. Annual Taxes
- $3,800
Year Built
- Built in 2024
Lot Details
- 4.17 Acre Lot
- Property is zoned R1
Parking
- 2 Car Garage
Home Design
- Colonial Architecture
- Frame Construction
Interior Spaces
- 5,538 Sq Ft Home
- 1 Fireplace
- Basement Fills Entire Space Under The House
Bedrooms and Bathrooms
- 5 Bedrooms
Outdoor Features
- Porch
Utilities
- Cooling Available
- Heating System Uses Natural Gas
- Baseboard Heating
- Private Water Source
- Private Sewer
Community Details
- No Home Owners Association
Listing and Financial Details
- Assessor Parcel Number M:012.0 B:0008 L:0000.0,4015114
Map
Home Values in the Area
Average Home Value in this Area
Tax History
| Year | Tax Paid | Tax Assessment Tax Assessment Total Assessment is a certain percentage of the fair market value that is determined by local assessors to be the total taxable value of land and additions on the property. | Land | Improvement |
|---|---|---|---|---|
| 2025 | $38 | $316,400 | $181,500 | $134,900 |
| 2024 | $1,773 | $142,400 | $142,400 | $0 |
| 2023 | $1,883 | $142,400 | $142,400 | $0 |
| 2022 | $2,944 | $214,100 | $214,100 | $0 |
| 2021 | $5,369 | $208,400 | $208,400 | $0 |
| 2020 | $2,839 | $195,400 | $195,400 | $0 |
| 2019 | $2,861 | $195,400 | $195,400 | $0 |
| 2018 | $5,092 | $191,600 | $191,600 | $0 |
| 2017 | $2,906 | $203,200 | $203,200 | $0 |
| 2016 | $3,015 | $203,200 | $203,200 | $0 |
| 2015 | $2,827 | $203,200 | $203,200 | $0 |
| 2014 | $2,782 | $217,200 | $217,200 | $0 |
Property History
| Date | Event | Price | List to Sale | Price per Sq Ft |
|---|---|---|---|---|
| 11/20/2025 11/20/25 | Price Changed | $799,000 | -11.2% | $144 / Sq Ft |
| 10/08/2025 10/08/25 | For Sale | $899,900 | -- | $162 / Sq Ft |
Purchase History
| Date | Type | Sale Price | Title Company |
|---|---|---|---|
| Quit Claim Deed | $210,000 | None Available | |
| Quit Claim Deed | $700,000 | None Available | |
| Quit Claim Deed | -- | -- | |
| Quit Claim Deed | -- | -- | |
| Deed | $137,000 | -- | |
| Deed | $137,000 | -- |
Mortgage History
| Date | Status | Loan Amount | Loan Type |
|---|---|---|---|
| Open | $168,000 | Purchase Money Mortgage |
Source: MLS Property Information Network (MLS PIN)
MLS Number: 73441186
APN: BERK-000120-000008
Disclaimer: Certain information contained herein is derived from information provided by parties other than Homes.com. All information provided is deemed reliable, but is not guaranteed to be accurate and should be independently verified.
![]() The property listing data and information, or the Images, set forth herein were provided to MLS Property Information Network, Inc. from third party sources, including sellers, lessors and public records, and were compiled by MLS Property Information Network, Inc. The property listing data and information, and the Images, are for the personal, non-commercial use of consumers having a good faith interest in purchasing or leasing listed properties of the type displayed to them and may not be used for any purpose other than to identify prospective properties which such consumers may have a good faith interest in purchasing or leasing. MLS Property Information Network, Inc. and its subscribers disclaim any and all representations and warranties as to the accuracy of the property listing data and information, or as to the accuracy of any of the Images, set forth herein.
The property listing data and information, or the Images, set forth herein were provided to MLS Property Information Network, Inc. from third party sources, including sellers, lessors and public records, and were compiled by MLS Property Information Network, Inc. The property listing data and information, and the Images, are for the personal, non-commercial use of consumers having a good faith interest in purchasing or leasing listed properties of the type displayed to them and may not be used for any purpose other than to identify prospective properties which such consumers may have a good faith interest in purchasing or leasing. MLS Property Information Network, Inc. and its subscribers disclaim any and all representations and warranties as to the accuracy of the property listing data and information, or as to the accuracy of any of the Images, set forth herein.
- 352 Main St Unit 3
- 30 Mary Ann Way
- 92 E Water St Unit 2nd Flr
- 41 County St
- 819 County St
- 840 County St
- 61 Plain St Unit 1F
- 83 Berkley St Unit 1
- 800 Couty Unit 3-20
- 8 Marvel St Unit 2
- 13 Plain St Unit 2
- 13 Plain St Unit 3
- 86 Forest St Unit 1 Bedroom Apt
- 42 Clinton St Unit 42 Clinton St. 2nd Flr.
- 30 White St Unit 1
- 226 Winthrop St Unit 2
- 240 High St
- 10 Bryant St Unit 2
- 25 Newcomb Place Unit 1
- 218-220 Old Colony Ave Unit 202