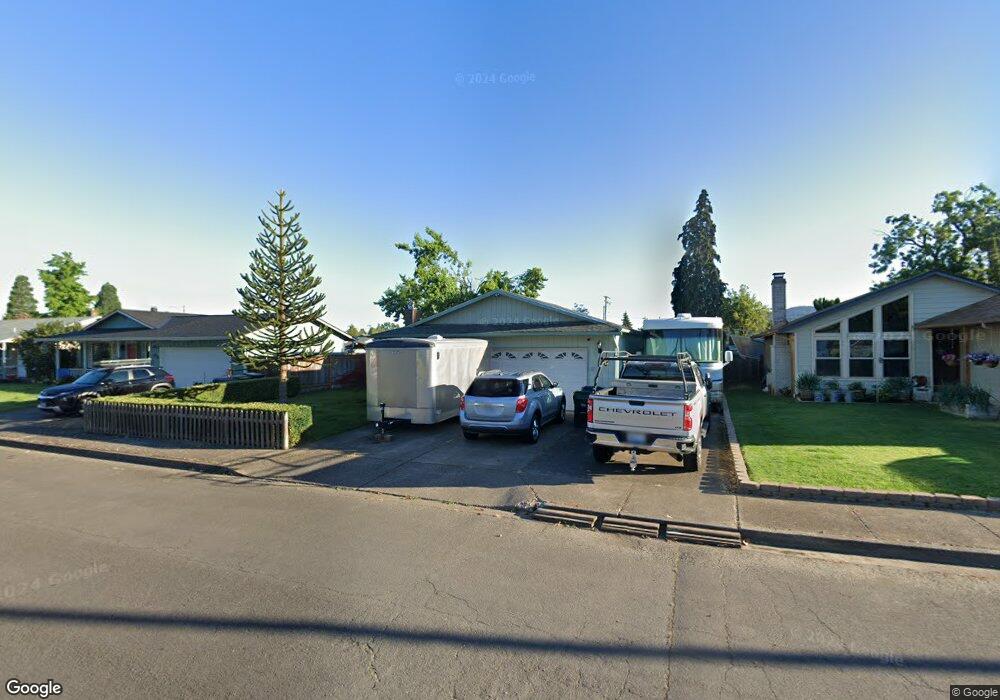
66 Shady Loop Springfield, OR 97477
North Springfield NeighborhoodEstimated Value: $442,000 - $484,000
3
Beds
2
Baths
1,689
Sq Ft
$271/Sq Ft
Est. Value
About This Home
This home is located at 66 Shady Loop, Springfield, OR 97477 and is currently estimated at $458,248, approximately $271 per square foot. 66 Shady Loop is a home located in Lane County with nearby schools including Elizabeth Page Elementary School, Hamlin Middle School, and Springfield High School.
Ownership History
Date
Name
Owned For
Owner Type
Purchase Details
Closed on
Dec 15, 2009
Sold by
Crawford Vincent James
Bought by
Crawford Vincent James and Crawford Kelly Colleen
Current Estimated Value
Home Financials for this Owner
Home Financials are based on the most recent Mortgage that was taken out on this home.
Original Mortgage
$188,000
Outstanding Balance
$122,190
Interest Rate
4.91%
Mortgage Type
New Conventional
Estimated Equity
$336,058
Purchase Details
Closed on
Aug 31, 2001
Sold by
Crawford Tammi Jo
Bought by
Crawford Vincent James
Purchase Details
Closed on
Nov 12, 1998
Sold by
Army Salvation
Bought by
Crawford Vince James and Crawford Tammi Jo
Home Financials for this Owner
Home Financials are based on the most recent Mortgage that was taken out on this home.
Original Mortgage
$104,900
Interest Rate
6.82%
Mortgage Type
FHA
Create a Home Valuation Report for This Property
The Home Valuation Report is an in-depth analysis detailing your home's value as well as a comparison with similar homes in the area
Home Values in the Area
Average Home Value in this Area
Purchase History
| Date | Buyer | Sale Price | Title Company |
|---|---|---|---|
| Crawford Vincent James | -- | Cascade Title Co | |
| Crawford Vincent James | -- | -- | |
| Crawford Vince James | $95,000 | Western Pioneer Title Co |
Source: Public Records
Mortgage History
| Date | Status | Borrower | Loan Amount |
|---|---|---|---|
| Open | Crawford Vincent James | $188,000 | |
| Previous Owner | Crawford Vince James | $104,900 |
Source: Public Records
Tax History
| Year | Tax Paid | Tax Assessment Tax Assessment Total Assessment is a certain percentage of the fair market value that is determined by local assessors to be the total taxable value of land and additions on the property. | Land | Improvement |
|---|---|---|---|---|
| 2025 | $4,521 | $246,546 | -- | -- |
| 2024 | $4,448 | $239,366 | -- | -- |
| 2023 | $4,448 | $232,395 | $0 | $0 |
| 2022 | $4,119 | $225,627 | $0 | $0 |
| 2021 | $4,046 | $219,056 | $0 | $0 |
| 2020 | $3,927 | $212,676 | $0 | $0 |
| 2019 | $3,809 | $206,482 | $0 | $0 |
| 2018 | $3,591 | $194,629 | $0 | $0 |
| 2017 | $3,453 | $194,629 | $0 | $0 |
| 2016 | $3,380 | $188,960 | $0 | $0 |
| 2015 | $3,284 | $183,456 | $0 | $0 |
| 2014 | $3,234 | $178,113 | $0 | $0 |
Source: Public Records
Map
Nearby Homes
- 77 Shady Loop
- 126 Woodlane Dr
- 421 Woodlane Dr
- 364 Scotts Glen Dr
- 2150 Laura St Unit 119
- 2150 Laura St Unit 111
- 2150 Laura St Unit 39
- 2150 Laura St Unit 57
- 2150 Laura St Unit 83
- 2150 Laura St Unit 44
- 2150 Laura (#57) St Unit 57
- 212 Hayden Bridge Way
- 451 Lochaven Ave
- 40 Allen Ave
- 485 Scotts Glen Dr
- 2136 8th St
- 780 Q St
- 535 Pacific Ave
- 2268 9th St
- 937 S St
Your Personal Tour Guide
Ask me questions while you tour the home.