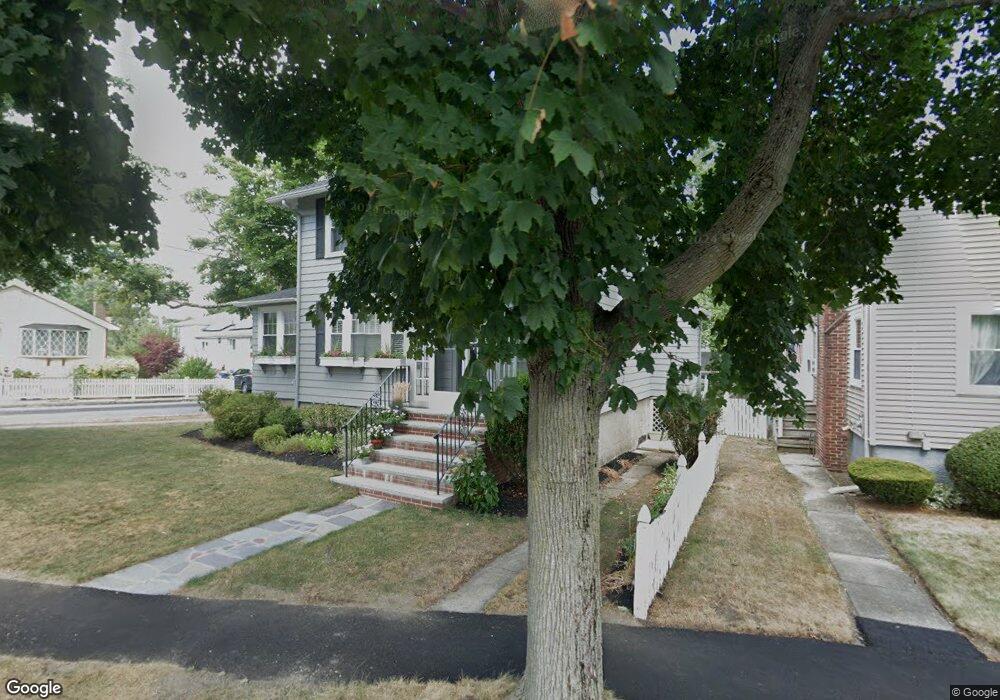
66 Sherman St Quincy, MA 02170
West Quincy NeighborhoodEstimated Value: $617,000 - $757,000
3
Beds
2
Baths
1,408
Sq Ft
$500/Sq Ft
Est. Value
About This Home
This home is located at 66 Sherman St, Quincy, MA 02170 and is currently estimated at $704,408, approximately $500 per square foot. 66 Sherman St is a home located in Norfolk County with nearby schools including Montclair Elementary School, Atlantic Middle School, and North Quincy High School.
Ownership History
Date
Name
Owned For
Owner Type
Purchase Details
Closed on
Oct 13, 1994
Sold by
Deveau Francis E
Bought by
Tabeek Michelle M and Tabeek Michael J
Current Estimated Value
Purchase Details
Closed on
Nov 28, 1990
Sold by
Moran Doris L
Bought by
Deveau Francis E
Create a Home Valuation Report for This Property
The Home Valuation Report is an in-depth analysis detailing your home's value as well as a comparison with similar homes in the area
Home Values in the Area
Average Home Value in this Area
Purchase History
We collect this data history from publicly available records. To have your information removed, we recommend requesting removal directly through your county’s website.
| Date | Buyer | Sale Price | Title Company |
|---|---|---|---|
| Tabeek Michelle M | $152,000 | -- | |
| Deveau Francis E | $150,000 | -- |
Source: Public Records
Mortgage History
We collect this data history from publicly available records. To have your information removed, we recommend requesting removal directly through your county’s website.
| Date | Status | Borrower | Loan Amount |
|---|---|---|---|
| Open | Deveau Francis E | $143,500 | |
| Closed | Deveau Francis E | $139,500 | |
| Closed | Deveau Francis E | $131,000 |
Source: Public Records
Tax History
| Year | Tax Paid | Tax Assessment Tax Assessment Total Assessment is a certain percentage of the fair market value that is determined by local assessors to be the total taxable value of land and additions on the property. | Land | Improvement |
|---|---|---|---|---|
| 2025 | $7,537 | $653,700 | $332,300 | $321,400 |
| 2024 | $7,296 | $647,400 | $332,300 | $315,100 |
| 2023 | $6,789 | $610,000 | $316,600 | $293,400 |
| 2022 | $6,571 | $548,500 | $275,200 | $273,300 |
| 2021 | $6,241 | $514,100 | $262,200 | $251,900 |
| 2020 | $6,130 | $493,200 | $262,200 | $231,000 |
| 2019 | $5,838 | $465,200 | $245,000 | $220,200 |
| 2018 | $5,750 | $431,000 | $226,800 | $204,200 |
| 2017 | $5,688 | $401,400 | $216,000 | $185,400 |
| 2016 | $5,197 | $361,900 | $187,900 | $174,000 |
| 2015 | $4,830 | $330,800 | $170,800 | $160,000 |
| 2014 | $4,584 | $308,500 | $162,600 | $145,900 |
Source: Public Records
Map
Nearby Homes
- 30 Elmwood Park
- 134 Sherman St
- 169 Pine St
- 33 Bishop Rd Unit 33
- 30 Hillside Ave
- 135 Safford St
- 267-269 Farrington St
- 440 Granite Ave Unit 201
- 98 Safford St
- 157 Beale St Unit 6
- 157 Beale St Unit 1
- 79 Holbrook Rd Unit 2
- 186 Granite Ave
- 45 Holbrook Rd
- 60 Montclair Ave
- 94 Grafton Ave
- 115 W Squantum St Unit 203
- 28 Sagamore Ave
- 100 W Squantum St Unit 516
- 18 Jenness St
- 51 Piermont St
- 52 Sherman St
- 47 Piermont St
- 48 Sherman St
- 43 Piermont St
- 33 Elmwood Park Unit 5
- 33 Elmwood Park Unit 4
- 33 Elmwood Park Unit 3
- 33 Elmwood Park Unit 2
- 33 Elmwood Park Unit 1
- 59 Sherman St
- 57 Sherman St
- 55 Sherman St
- 27 Elmwood Park Unit 1
- 27 Elmwood Park
- 27 Elmwood Park Unit 3
- 27 Elmwood Park Unit 2
- 27 Elmwood Park Unit 6
- 44 Sherman St
- 39 Piermont St
Your Personal Tour Guide
Ask me questions while you tour the home.