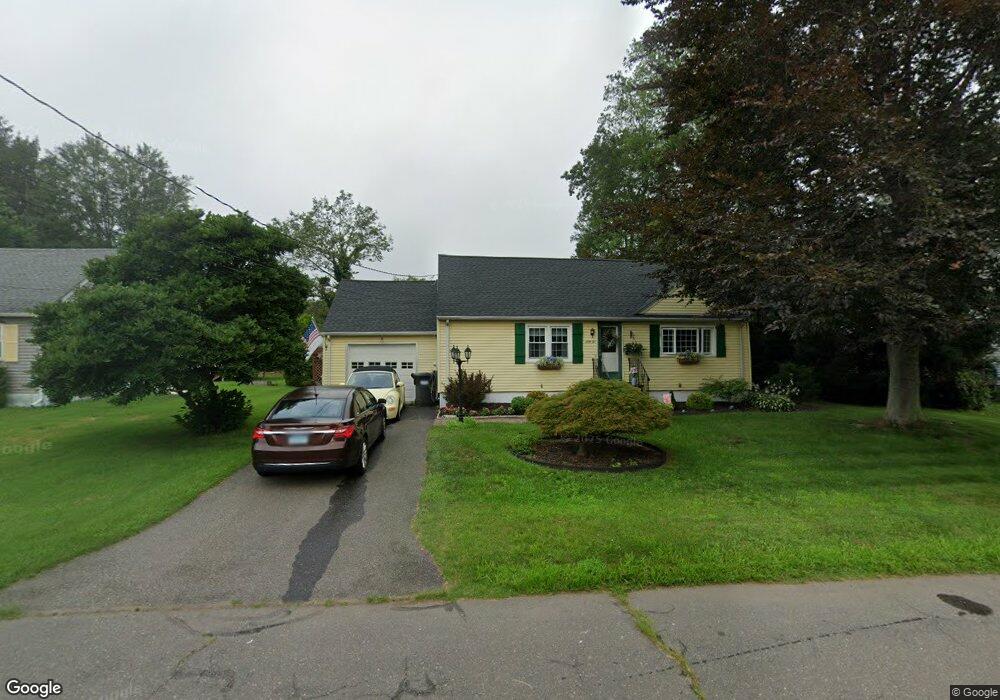
66 Sperry Ln Meriden, CT 06451
Estimated Value: $303,772 - $373,000
3
Beds
1
Bath
900
Sq Ft
$360/Sq Ft
Est. Value
About This Home
This home is located at 66 Sperry Ln, Meriden, CT 06451 and is currently estimated at $324,443, approximately $360 per square foot. 66 Sperry Ln is a home located in New Haven County with nearby schools including Benjamin Franklin School, Lincoln Middle School, and Orville H. Platt High School.
Ownership History
Date
Name
Owned For
Owner Type
Purchase Details
Closed on
Mar 5, 2012
Sold by
Sorota Deborah and Lehne Deborah
Bought by
Lehne Deborah and Lehne Arthur
Current Estimated Value
Home Financials for this Owner
Home Financials are based on the most recent Mortgage that was taken out on this home.
Original Mortgage
$162,899
Outstanding Balance
$115,082
Interest Rate
4.4%
Mortgage Type
FHA
Estimated Equity
$209,361
Purchase Details
Closed on
Oct 11, 1991
Sold by
Dziama Walter E and Dziama Pauline
Bought by
Sorota Thomas P and Sorota Deborah A
Create a Home Valuation Report for This Property
The Home Valuation Report is an in-depth analysis detailing your home's value as well as a comparison with similar homes in the area
Home Values in the Area
Average Home Value in this Area
Purchase History
| Date | Buyer | Sale Price | Title Company |
|---|---|---|---|
| Lehne Deborah | -- | -- | |
| Sorota Thomas P | $127,000 | -- |
Source: Public Records
Mortgage History
| Date | Status | Borrower | Loan Amount |
|---|---|---|---|
| Open | Sorota Thomas P | $162,899 | |
| Previous Owner | Sorota Thomas P | $16,013 | |
| Previous Owner | Sorota Thomas P | $155,000 | |
| Previous Owner | Sorota Thomas P | $122,982 |
Source: Public Records
Tax History Compared to Growth
Tax History
| Year | Tax Paid | Tax Assessment Tax Assessment Total Assessment is a certain percentage of the fair market value that is determined by local assessors to be the total taxable value of land and additions on the property. | Land | Improvement |
|---|---|---|---|---|
| 2024 | $4,730 | $130,270 | $42,770 | $87,500 |
| 2023 | $4,532 | $130,270 | $42,770 | $87,500 |
| 2022 | $4,314 | $130,760 | $42,770 | $87,990 |
| 2021 | $4,322 | $105,770 | $41,160 | $64,610 |
| 2020 | $4,322 | $105,770 | $41,160 | $64,610 |
| 2019 | $4,044 | $98,980 | $41,160 | $57,820 |
| 2018 | $4,062 | $98,980 | $41,160 | $57,820 |
| 2017 | $3,951 | $98,980 | $41,160 | $57,820 |
| 2016 | $4,021 | $109,830 | $46,550 | $63,280 |
| 2015 | $4,021 | $109,760 | $46,480 | $63,280 |
| 2014 | $3,923 | $109,760 | $46,480 | $63,280 |
Source: Public Records
Map
Nearby Homes