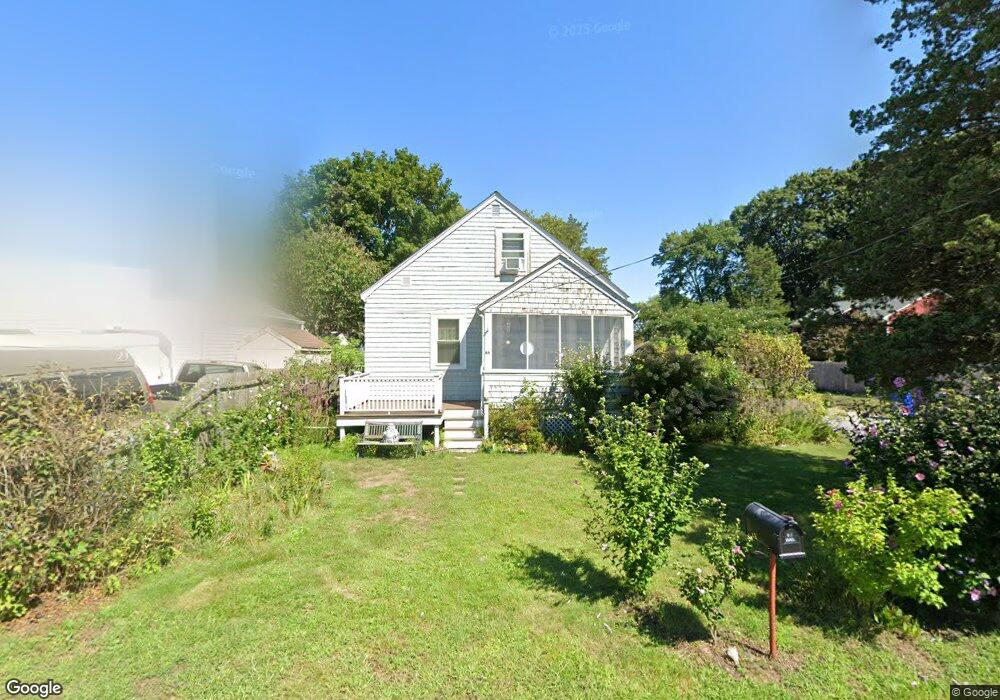
66 Spring St Riverside, RI 02915
Riverside NeighborhoodEstimated Value: $374,000 - $438,000
3
Beds
1
Bath
1,332
Sq Ft
$297/Sq Ft
Est. Value
About This Home
This home is located at 66 Spring St, Riverside, RI 02915 and is currently estimated at $396,127, approximately $297 per square foot. 66 Spring St is a home located in Providence County with nearby schools including East Providence High School, St Luke Elementary School, and Barrington Christian Academy.
Ownership History
Date
Name
Owned For
Owner Type
Purchase Details
Closed on
Jul 21, 2021
Sold by
Shisko Guy G and Perron Barbara J
Bought by
Shisko Guy G and Perron Barbara J
Current Estimated Value
Purchase Details
Closed on
Nov 10, 2000
Sold by
Germane Paula
Bought by
Shisko Beatrice T
Home Financials for this Owner
Home Financials are based on the most recent Mortgage that was taken out on this home.
Original Mortgage
$80,000
Interest Rate
7.81%
Mortgage Type
Purchase Money Mortgage
Create a Home Valuation Report for This Property
The Home Valuation Report is an in-depth analysis detailing your home's value as well as a comparison with similar homes in the area
Home Values in the Area
Average Home Value in this Area
Purchase History
| Date | Buyer | Sale Price | Title Company |
|---|---|---|---|
| Shisko Guy G | -- | None Available | |
| Shisko Guy G | -- | None Available | |
| Shisko Beatrice T | $120,000 | -- | |
| Shisko Beatrice T | $120,000 | -- |
Source: Public Records
Mortgage History
| Date | Status | Borrower | Loan Amount |
|---|---|---|---|
| Previous Owner | Shisko Beatrice T | $57,000 | |
| Previous Owner | Shisko Beatrice T | $80,000 |
Source: Public Records
Tax History
| Year | Tax Paid | Tax Assessment Tax Assessment Total Assessment is a certain percentage of the fair market value that is determined by local assessors to be the total taxable value of land and additions on the property. | Land | Improvement |
|---|---|---|---|---|
| 2025 | $3,448 | $263,800 | $73,200 | $190,600 |
| 2024 | $3,719 | $242,600 | $61,000 | $181,600 |
| 2023 | $3,581 | $242,600 | $61,000 | $181,600 |
| 2022 | $3,480 | $159,200 | $36,200 | $123,000 |
| 2021 | $3,423 | $159,200 | $34,900 | $124,300 |
| 2020 | $3,278 | $159,200 | $34,900 | $124,300 |
| 2019 | $3,187 | $159,200 | $34,900 | $124,300 |
| 2018 | $2,732 | $119,400 | $37,300 | $82,100 |
| 2017 | $2,671 | $119,400 | $37,300 | $82,100 |
| 2016 | $2,658 | $119,400 | $37,300 | $82,100 |
| 2015 | $2,795 | $121,800 | $34,500 | $87,300 |
| 2014 | $2,795 | $121,800 | $34,500 | $87,300 |
Source: Public Records
Map
Nearby Homes
Your Personal Tour Guide
Ask me questions while you tour the home.