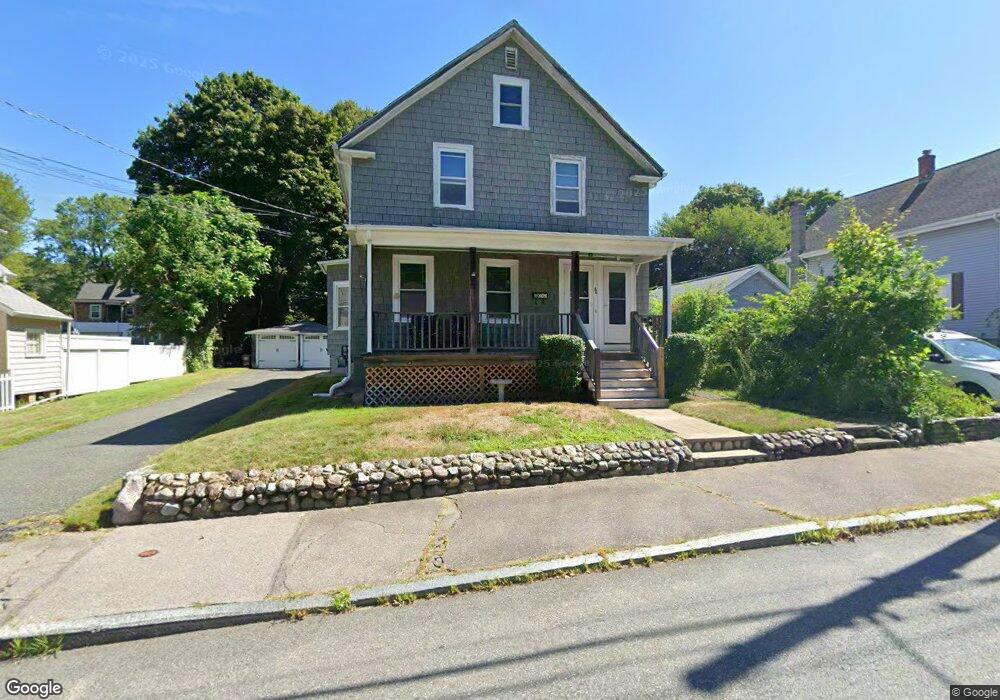
66 Spruce St North Attleboro, MA 02760
North Attleboro NeighborhoodEstimated Value: $531,062 - $688,000
5
Beds
2
Baths
2,184
Sq Ft
$279/Sq Ft
Est. Value
About This Home
This home is located at 66 Spruce St, North Attleboro, MA 02760 and is currently estimated at $609,516, approximately $279 per square foot. 66 Spruce St is a home located in Bristol County with nearby schools including North Attleboro High School and Cadence Academy Preschool - North Attleborough.
Ownership History
Date
Name
Owned For
Owner Type
Purchase Details
Closed on
Jun 12, 2025
Sold by
Schofield David M Est and Schofield
Bought by
Schofield Thomas C and Schofield Elizabeth
Current Estimated Value
Purchase Details
Closed on
Feb 17, 2020
Sold by
Schofield Thomas C
Bought by
Schofield David M
Home Financials for this Owner
Home Financials are based on the most recent Mortgage that was taken out on this home.
Original Mortgage
$279,500
Interest Rate
3.6%
Mortgage Type
New Conventional
Create a Home Valuation Report for This Property
The Home Valuation Report is an in-depth analysis detailing your home's value as well as a comparison with similar homes in the area
Home Values in the Area
Average Home Value in this Area
Purchase History
| Date | Buyer | Sale Price | Title Company |
|---|---|---|---|
| Schofield Thomas C | -- | None Available | |
| Schofield Thomas C | -- | None Available | |
| Schofield David M | $380,000 | None Available | |
| Schofield David M | $380,000 | None Available |
Source: Public Records
Mortgage History
| Date | Status | Borrower | Loan Amount |
|---|---|---|---|
| Previous Owner | Schofield David M | $279,500 |
Source: Public Records
Tax History Compared to Growth
Tax History
| Year | Tax Paid | Tax Assessment Tax Assessment Total Assessment is a certain percentage of the fair market value that is determined by local assessors to be the total taxable value of land and additions on the property. | Land | Improvement |
|---|---|---|---|---|
| 2025 | $5,112 | $433,600 | $120,500 | $313,100 |
| 2024 | $4,902 | $424,800 | $120,500 | $304,300 |
| 2023 | $4,677 | $365,700 | $120,500 | $245,200 |
| 2022 | $4,931 | $354,000 | $120,500 | $233,500 |
| 2021 | $0 | $322,300 | $120,500 | $201,800 |
| 2020 | $0 | $288,700 | $120,500 | $168,200 |
| 2019 | $3,956 | $277,800 | $109,600 | $168,200 |
| 2018 | $3,259 | $244,300 | $109,600 | $134,700 |
| 2017 | $0 | $244,300 | $109,600 | $134,700 |
| 2016 | $2,902 | $219,500 | $121,800 | $97,700 |
| 2015 | $2,964 | $225,600 | $127,900 | $97,700 |
| 2014 | $2,970 | $224,300 | $118,200 | $106,100 |
Source: Public Records
Map
Nearby Homes
- 64 Smith St
- 8 Al Pace Dr Unit 8
- 1066 Mount Hope St
- 35-R Whiting St
- 212 Fisher St Unit A5
- 217 Fisher St
- 68 Fisher St
- 633 E Washington St Unit 10
- 45 Moran St
- 20 South St
- 0 Landry 2nd Unit 73350867
- 880 Landry Ave Unit 2
- 42 2nd Ave Unit 24
- 19 Church St Unit A5
- 12 Houde St
- 16 Richards Ave Unit 106
- 711 Mount Hope St Unit 7
- 711 Mount Hope St Unit 6
- 711 Mount Hope St Unit 8
- 711 Mount Hope St Unit 5