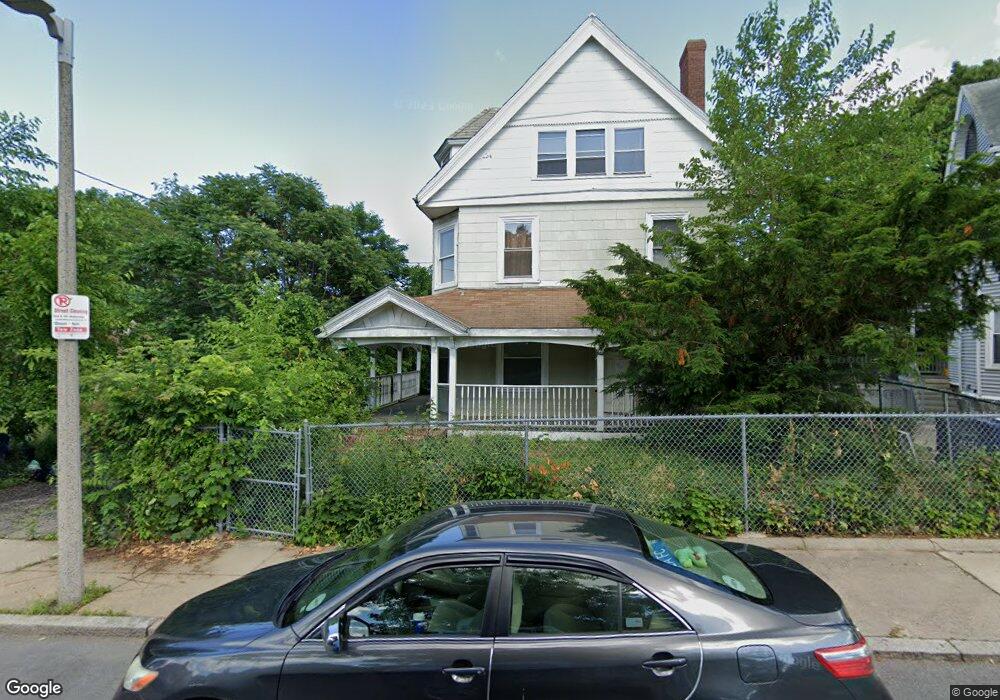
66 Stanley St Boston, MA 02125
Bowdoin North-Mount Bowdoin NeighborhoodEstimated Value: $994,000 - $2,229,203
4
Beds
2
Baths
2,000
Sq Ft
$733/Sq Ft
Est. Value
About This Home
This home is located at 66 Stanley St, Boston, MA 02125 and is currently estimated at $1,466,801, approximately $733 per square foot. 66 Stanley St is a home located in Suffolk County with nearby schools including Uncommon Schools Roxbury Prep Dorchester Campus.
Ownership History
Date
Name
Owned For
Owner Type
Purchase Details
Closed on
Jan 12, 2023
Sold by
Chew Peter and Mei Manna
Bought by
66 Stanley Rt and Chew
Current Estimated Value
Purchase Details
Closed on
Oct 10, 2019
Sold by
Simpson Matthew
Bought by
Ap Group Llc
Purchase Details
Closed on
Feb 6, 2018
Sold by
Five Star Capital T and Ciampa
Bought by
Simpson Matthew
Home Financials for this Owner
Home Financials are based on the most recent Mortgage that was taken out on this home.
Original Mortgage
$500,000
Interest Rate
3.94%
Mortgage Type
New Conventional
Purchase Details
Closed on
Feb 5, 2016
Sold by
Ciampa Frank
Bought by
5 Star Capital T and Ciampa
Home Financials for this Owner
Home Financials are based on the most recent Mortgage that was taken out on this home.
Original Mortgage
$295,000
Interest Rate
3.98%
Mortgage Type
New Conventional
Purchase Details
Closed on
Jan 23, 2007
Sold by
Vazquez Adita
Bought by
Vazquez Adita and Bodden Marvin R
Home Financials for this Owner
Home Financials are based on the most recent Mortgage that was taken out on this home.
Original Mortgage
$508,000
Interest Rate
6.14%
Mortgage Type
Purchase Money Mortgage
Purchase Details
Closed on
Jan 19, 2007
Sold by
Mm Orion Dev Ltd
Bought by
64 -64R Stanley Street and Mcelhinney
Home Financials for this Owner
Home Financials are based on the most recent Mortgage that was taken out on this home.
Original Mortgage
$508,000
Interest Rate
6.14%
Mortgage Type
Purchase Money Mortgage
Purchase Details
Closed on
Jan 18, 2007
Sold by
Mm Orion Dev Ltd
Bought by
Vazquez Adita
Home Financials for this Owner
Home Financials are based on the most recent Mortgage that was taken out on this home.
Original Mortgage
$508,000
Interest Rate
6.14%
Mortgage Type
Purchase Money Mortgage
Purchase Details
Closed on
Sep 21, 2006
Sold by
Scimone Kelly B
Bought by
Mm Orion Dev Ltd
Purchase Details
Closed on
May 25, 2006
Sold by
Herbawi Sami
Bought by
Mackenzie Alexander J and Scimone Kelly B
Purchase Details
Closed on
Nov 17, 1997
Sold by
Iag Fcu
Bought by
Stanley Rt and Rosarion Yolaine
Home Financials for this Owner
Home Financials are based on the most recent Mortgage that was taken out on this home.
Original Mortgage
$111,000
Interest Rate
7.23%
Mortgage Type
Purchase Money Mortgage
Purchase Details
Closed on
Aug 11, 1997
Sold by
Gregory Murphy L
Bought by
Iag Federal Cu
Create a Home Valuation Report for This Property
The Home Valuation Report is an in-depth analysis detailing your home's value as well as a comparison with similar homes in the area
Home Values in the Area
Average Home Value in this Area
Purchase History
We collect this data history from publicly available records. To have your information removed, we recommend requesting removal directly through your county’s website.
| Date | Buyer | Sale Price | Title Company |
|---|---|---|---|
| 66 Stanley Rt | -- | None Available | |
| Ap Group Llc | -- | -- | |
| Simpson Matthew | $625,000 | -- | |
| 5 Star Capital T | -- | -- | |
| Ciampa Frank | $285,000 | -- | |
| Vazquez Adita | -- | -- | |
| 64 -64R Stanley Street | $110,500 | -- | |
| 64 -64R Stanley Street | $110,500 | -- | |
| Vazquez Adita | $635,000 | -- | |
| Mm Orion Dev Ltd | -- | -- | |
| Scimone Kelly B | -- | -- | |
| Mackenzie Alexander J | $500,000 | -- | |
| Herbawi Sami | $500,000 | -- | |
| Stanley Rt | $78,000 | -- | |
| Iag Federal Cu | $119,000 | -- |
Source: Public Records
Mortgage History
We collect this data history from publicly available records. To have your information removed, we recommend requesting removal directly through your county’s website.
| Date | Status | Borrower | Loan Amount |
|---|---|---|---|
| Previous Owner | Simpson Matthew | $500,000 | |
| Previous Owner | Ciampa Frank | $295,000 | |
| Previous Owner | Vazquez Adita | $508,000 | |
| Previous Owner | Iag Federal Cu | $300,000 | |
| Previous Owner | Iag Federal Cu | $35,000 | |
| Previous Owner | Iag Federal Cu | $111,000 |
Source: Public Records
Tax History
| Year | Tax Paid | Tax Assessment Tax Assessment Total Assessment is a certain percentage of the fair market value that is determined by local assessors to be the total taxable value of land and additions on the property. | Land | Improvement |
|---|---|---|---|---|
| 2025 | $15,731 | $1,358,500 | $366,300 | $992,200 |
| 2024 | $14,357 | $1,317,200 | $283,600 | $1,033,600 |
| 2023 | $13,227 | $1,231,600 | $250,200 | $981,400 |
| 2022 | $12,533 | $1,151,900 | $236,000 | $915,900 |
| 2021 | $11,182 | $1,048,000 | $220,600 | $827,400 |
| 2020 | $9,657 | $914,500 | $0 | $914,500 |
| 2019 | $9,065 | $860,100 | $148,400 | $711,700 |
| 2018 | $8,145 | $777,200 | $148,400 | $628,800 |
| 2017 | $7,737 | $730,600 | $148,400 | $582,200 |
| 2016 | $6,414 | $583,104 | $142,464 | $440,640 |
| 2015 | $6,037 | $498,542 | $131,150 | $367,392 |
| 2014 | $5,669 | $450,640 | $131,150 | $319,490 |
Source: Public Records
Map
Nearby Homes
- 66 Stanley St Unit 1
- 66 Stanley St Unit 3
- 66 Stanley St Unit 2
- 66-66R Stanley St
- 60 Stanley St Unit 202
- 76 Bellevue St
- 40 Barry St
- 73 Hamilton St
- 51 Ceylon St
- 252-254 Magnolia St
- 20 Potosi St
- 16 Church St
- 28 Fifield St
- 37 Stonehurst St
- 193 Hamilton St Unit 3
- 173 Magnolia St Unit 5
- 19 Glen St Unit 1
- 103 Hancock St Unit 1
- 28 Church St Unit 3
- 33 Adams St Unit 1
- 66 Stanley St Unit 66R
- 66 Stanley St Unit 2
- 66R Stanley St Unit 2
- 66R Stanley St Unit 1
- 2 Kane St
- 2 Kane St Unit 2
- 68 Stanley St
- 62 Bellevue St Unit 64
- 62 Bellevue St Unit 1
- 62 Bellevue St Unit 2
- 62 Bellevue St Unit 3
- 67 Bellevue St Unit B
- 67 Bellevue St Unit A
- 67 Bellevue St
- 60 Stanley St Unit 302
- 60 Stanley St
- 60 Stanley St Unit 102
- 60 Bellevue St
- 60 Bellevue St Unit 2
- 60 Bellevue St
Your Personal Tour Guide
Ask me questions while you tour the home.