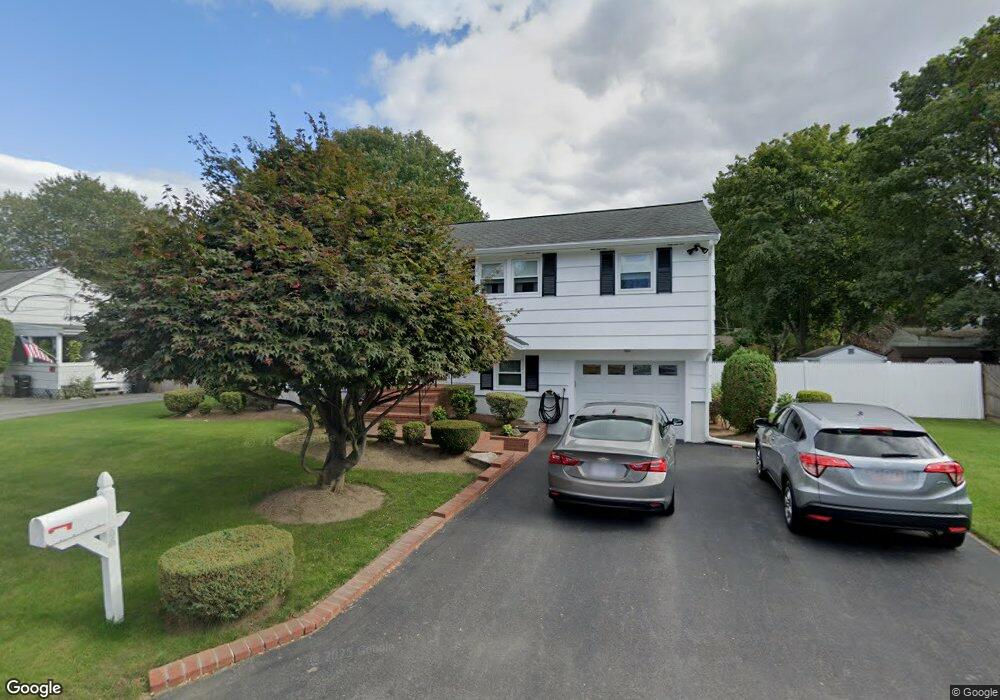
66 Taft Ave Brockton, MA 02301
Estimated Value: $521,000 - $588,000
3
Beds
1
Bath
1,584
Sq Ft
$353/Sq Ft
Est. Value
About This Home
This home is located at 66 Taft Ave, Brockton, MA 02301 and is currently estimated at $559,902, approximately $353 per square foot. 66 Taft Ave is a home located in Plymouth County with nearby schools including Hancock Elementary School, Manthala George Jr. School, and Louis F Angelo Elementary School.
Ownership History
Date
Name
Owned For
Owner Type
Purchase Details
Closed on
Feb 19, 1993
Sold by
Bortolotti Alfred W
Bought by
Lobaton Lucio and Lobaton Nancy E
Current Estimated Value
Home Financials for this Owner
Home Financials are based on the most recent Mortgage that was taken out on this home.
Original Mortgage
$90,400
Interest Rate
8.06%
Mortgage Type
Purchase Money Mortgage
Create a Home Valuation Report for This Property
The Home Valuation Report is an in-depth analysis detailing your home's value as well as a comparison with similar homes in the area
Home Values in the Area
Average Home Value in this Area
Purchase History
| Date | Buyer | Sale Price | Title Company |
|---|---|---|---|
| Lobaton Lucio | $113,000 | -- |
Source: Public Records
Mortgage History
| Date | Status | Borrower | Loan Amount |
|---|---|---|---|
| Open | Lobaton Lucio | $66,000 | |
| Closed | Lobaton Lucio | $73,500 | |
| Closed | Lobaton Lucio | $90,400 | |
| Previous Owner | Lobaton Lucio | $8,000 |
Source: Public Records
Tax History Compared to Growth
Tax History
| Year | Tax Paid | Tax Assessment Tax Assessment Total Assessment is a certain percentage of the fair market value that is determined by local assessors to be the total taxable value of land and additions on the property. | Land | Improvement |
|---|---|---|---|---|
| 2025 | $5,784 | $477,600 | $144,400 | $333,200 |
| 2024 | $5,740 | $477,500 | $144,400 | $333,100 |
| 2023 | $5,679 | $437,500 | $109,100 | $328,400 |
| 2022 | $5,202 | $372,400 | $99,100 | $273,300 |
| 2021 | $4,881 | $336,600 | $92,500 | $244,100 |
| 2020 | $4,903 | $323,600 | $88,800 | $234,800 |
| 2019 | $4,623 | $297,500 | $82,600 | $214,900 |
| 2018 | $4,235 | $263,700 | $82,600 | $181,100 |
| 2017 | $4,236 | $263,100 | $82,600 | $180,500 |
| 2016 | $3,956 | $227,900 | $78,700 | $149,200 |
| 2015 | $3,973 | $218,900 | $78,700 | $140,200 |
| 2014 | $3,896 | $214,900 | $78,700 | $136,200 |
Source: Public Records
Map
Nearby Homes