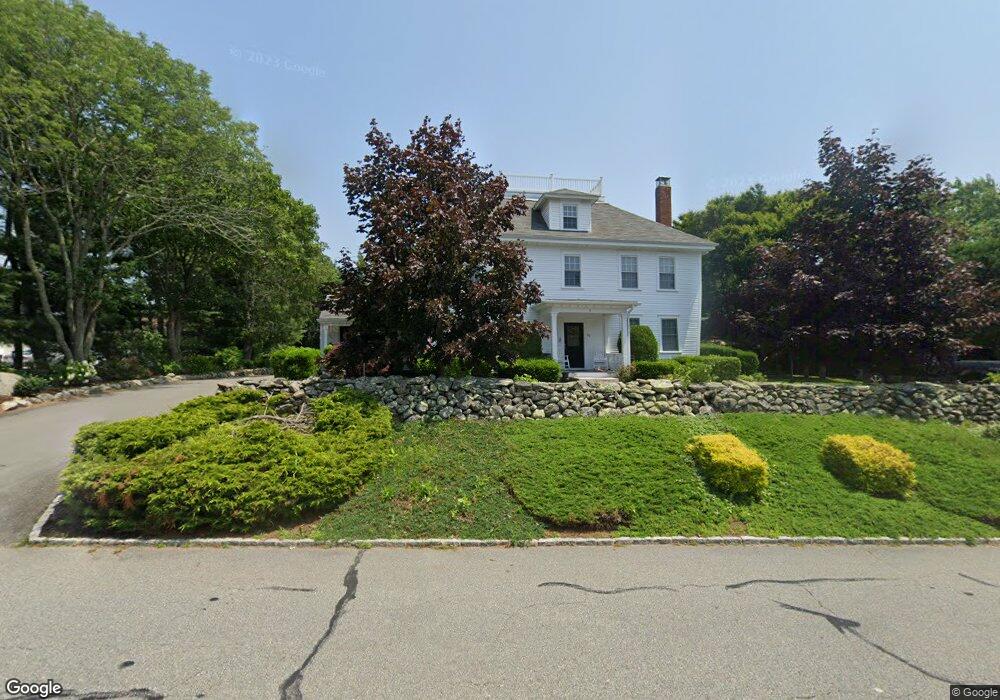
66 Tucker Ln North Dartmouth, MA 02747
North Apponagansett NeighborhoodEstimated Value: $599,000 - $1,194,000
5
Beds
6
Baths
3,662
Sq Ft
$260/Sq Ft
Est. Value
About This Home
This home is located at 66 Tucker Ln, North Dartmouth, MA 02747 and is currently estimated at $951,945, approximately $259 per square foot. 66 Tucker Ln is a home located in Bristol County with nearby schools including Dartmouth High School, Friends Academy, and Our Sister's School.
Ownership History
Date
Name
Owned For
Owner Type
Purchase Details
Closed on
Mar 18, 2025
Sold by
Arruda Ft and Arruda
Bought by
Joa Llc
Current Estimated Value
Purchase Details
Closed on
Dec 15, 2011
Sold by
Arruda Octavio A and Arruda Julieta M
Bought by
Arruda Ft and Arruda
Purchase Details
Closed on
Mar 14, 2008
Sold by
Chase Curtis
Bought by
Deutsche Bank Natl T C
Purchase Details
Closed on
Oct 31, 2005
Sold by
Compass Trading Corp
Bought by
Chase Curtis and Chase Heidi
Home Financials for this Owner
Home Financials are based on the most recent Mortgage that was taken out on this home.
Original Mortgage
$571,500
Interest Rate
5.79%
Mortgage Type
Purchase Money Mortgage
Purchase Details
Closed on
Sep 23, 2004
Sold by
Jacobsen Donald R and Jacobsen Elizabeth E
Bought by
Compass Trading Corp
Create a Home Valuation Report for This Property
The Home Valuation Report is an in-depth analysis detailing your home's value as well as a comparison with similar homes in the area
Home Values in the Area
Average Home Value in this Area
Purchase History
| Date | Buyer | Sale Price | Title Company |
|---|---|---|---|
| Joa Llc | -- | None Available | |
| Joa Llc | -- | None Available | |
| Joa Llc | -- | None Available | |
| Arruda Ft | -- | -- | |
| Arruda Ft | -- | -- | |
| Deutsche Bank Natl T C | $416,500 | -- | |
| Deutsche Bank Natl T C | $416,500 | -- | |
| Chase Curtis | $635,000 | -- | |
| Chase Curtis | $635,000 | -- | |
| Compass Trading Corp | $567,000 | -- | |
| Compass Trading Corp | $567,000 | -- |
Source: Public Records
Mortgage History
| Date | Status | Borrower | Loan Amount |
|---|---|---|---|
| Previous Owner | Compass Trading Corp | $385,000 | |
| Previous Owner | Compass Trading Corp | $571,500 |
Source: Public Records
Tax History Compared to Growth
Tax History
| Year | Tax Paid | Tax Assessment Tax Assessment Total Assessment is a certain percentage of the fair market value that is determined by local assessors to be the total taxable value of land and additions on the property. | Land | Improvement |
|---|---|---|---|---|
| 2025 | $8,244 | $957,500 | $249,100 | $708,400 |
| 2024 | $7,747 | $891,500 | $249,100 | $642,400 |
| 2023 | $7,977 | $869,900 | $249,100 | $620,800 |
| 2022 | $7,458 | $753,300 | $223,300 | $530,000 |
| 2021 | $7,132 | $688,400 | $191,900 | $496,500 |
| 2020 | $7,203 | $693,900 | $191,900 | $502,000 |
| 2019 | $6,527 | $627,600 | $191,900 | $435,700 |
| 2018 | $6,646 | $661,400 | $180,200 | $481,200 |
| 2017 | $6,956 | $694,200 | $207,800 | $486,400 |
| 2016 | $6,473 | $637,100 | $168,900 | $468,200 |
| 2015 | $6,387 | $629,900 | $170,900 | $459,000 |
| 2014 | $6,328 | $619,800 | $180,000 | $439,800 |
Source: Public Records
Map
Nearby Homes
- 29 Elizabeth Ct
- 33 Rosewood Terrace
- 24 Wayne Memorial Dr
- 6 Strathmore Rd
- 6 Jacob Dr
- 10 Westview Dr
- 25 Westwood Dr
- 14 Westview Dr
- 5 Samosett Dr
- 3 Mishawum Dr
- 6 Walters Way
- 360 Russells Mills Rd
- 0 Victoria St Unit 73457953
- 98 Mccabe St
- 729 Allen St
- 219 Chase Rd
- 75 Country Way Unit 75
- 212 Rockland St
- 50 Gaywood St
- 34 Country Way
- 66 Tucker Ln Unit 3
- 66 Tucker Ln Unit 2
- 66 Tucker Ln Unit 66
- 66 Tucker Ln Unit 1
- 74 Tucker Ln
- 64 Tucker Ln
- 69 Tucker Ln
- 67 Tucker Ln
- 73 Tucker Ln
- 26 William Bradford Rd
- 30 William Bradford Rd
- 62 Tucker Ln
- 40 William Bradford Rd
- 65 Tucker Ln
- 77 Tucker Ln
- 34 William Bradford Rd
- 22 William Bradford Rd
- 63 Tucker Ln
- 60 Tucker Ln
- 52 William Bradford Rd