66 Undine Cir Springfield, MA 01109
Sixteen Acres NeighborhoodEstimated Value: $183,000 - $270,000
2
Beds
1
Bath
630
Sq Ft
$363/Sq Ft
Est. Value
About This Home
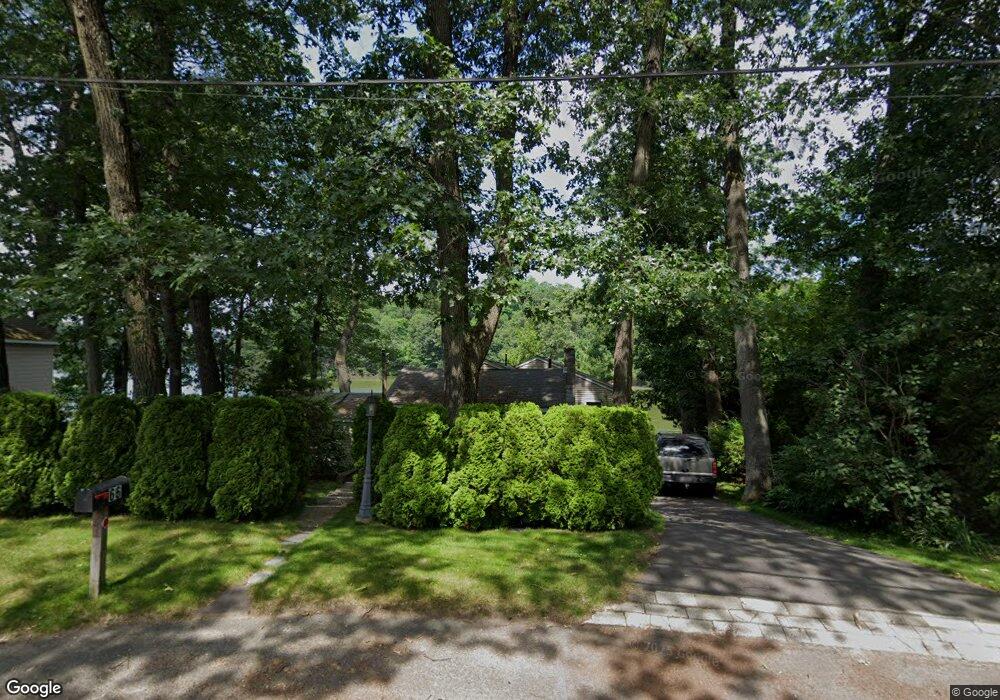
This home is located at 66 Undine Cir, Springfield, MA 01109 and is currently estimated at $228,775, approximately $363 per square foot. 66 Undine Cir is a home located in Hampden County with nearby schools including Frank H. Freedman School, John J Duggan Middle, and Springfield High School of Science and Technology.
Ownership History
Date
Name
Owned For
Owner Type
Purchase Details
Closed on
Oct 2, 2007
Sold by
Mangan Alice M and Collins John R
Bought by
Collins John R
Current Estimated Value
Home Financials for this Owner
Home Financials are based on the most recent Mortgage that was taken out on this home.
Original Mortgage
$129,000
Outstanding Balance
$82,380
Interest Rate
6.65%
Mortgage Type
Purchase Money Mortgage
Estimated Equity
$146,395
Purchase Details
Closed on
May 4, 2004
Sold by
Collins John R and Collins Suzanne
Bought by
Collins John R
Home Financials for this Owner
Home Financials are based on the most recent Mortgage that was taken out on this home.
Original Mortgage
$50,000
Interest Rate
5.36%
Mortgage Type
Purchase Money Mortgage
Purchase Details
Closed on
May 10, 2002
Sold by
Sullivan Kathleen E
Bought by
Collins John R and Collins Suzanne
Create a Home Valuation Report for This Property
The Home Valuation Report is an in-depth analysis detailing your home's value as well as a comparison with similar homes in the area
Home Values in the Area
Average Home Value in this Area
Purchase History
| Date | Buyer | Sale Price | Title Company |
|---|---|---|---|
| Collins John R | -- | -- | |
| Collins John R | -- | -- | |
| Collins John R | $52,000 | -- |
Source: Public Records
Mortgage History
| Date | Status | Borrower | Loan Amount |
|---|---|---|---|
| Open | Collins John R | $129,000 | |
| Previous Owner | Collins John R | $50,000 |
Source: Public Records
Tax History Compared to Growth
Tax History
| Year | Tax Paid | Tax Assessment Tax Assessment Total Assessment is a certain percentage of the fair market value that is determined by local assessors to be the total taxable value of land and additions on the property. | Land | Improvement |
|---|---|---|---|---|
| 2025 | $2,703 | $172,400 | $51,100 | $121,300 |
| 2024 | $2,759 | $171,800 | $51,100 | $120,700 |
| 2023 | $2,619 | $153,600 | $48,700 | $104,900 |
| 2022 | $2,774 | $147,400 | $48,700 | $98,700 |
| 2021 | $2,531 | $133,900 | $44,300 | $89,600 |
| 2020 | $2,381 | $121,900 | $44,300 | $77,600 |
| 2019 | $2,368 | $120,300 | $44,300 | $76,000 |
| 2018 | $2,322 | $118,000 | $44,300 | $73,700 |
| 2017 | $2,286 | $116,300 | $48,900 | $67,400 |
| 2016 | $2,391 | $121,600 | $48,900 | $72,700 |
| 2015 | $1,939 | $98,600 | $48,900 | $49,700 |
Source: Public Records
Map
Nearby Homes