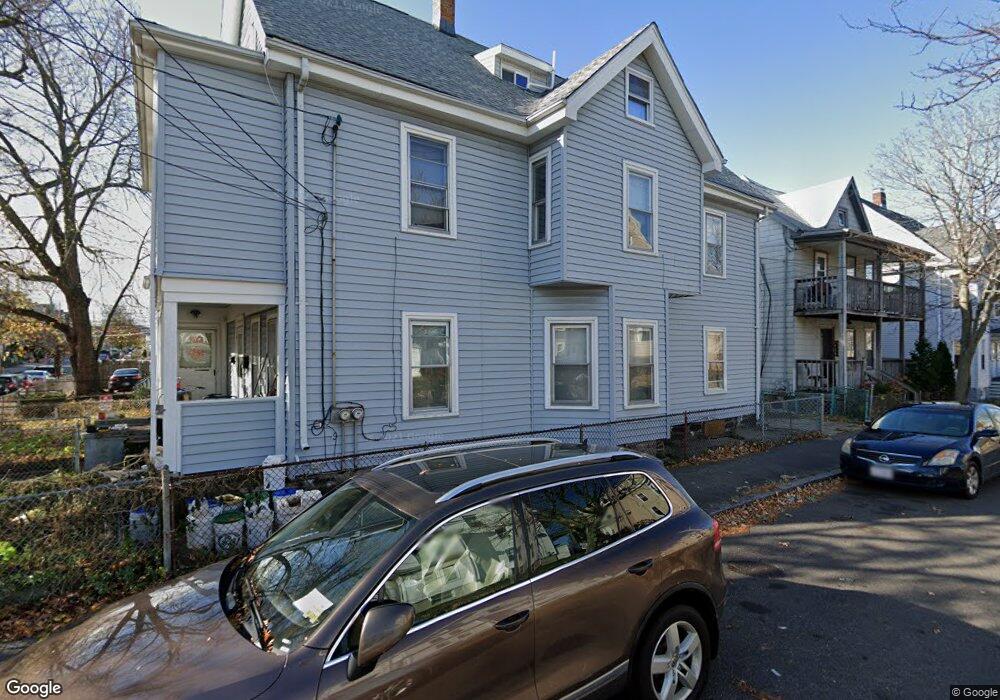
66 Upham St Unit 68 Malden, MA 02148
Suffolk Square NeighborhoodEstimated Value: $806,000 - $1,236,000
6
Beds
3
Baths
2,599
Sq Ft
$380/Sq Ft
Est. Value
About This Home
This home is located at 66 Upham St Unit 68, Malden, MA 02148 and is currently estimated at $988,848, approximately $380 per square foot. 66 Upham St Unit 68 is a home located in Middlesex County with nearby schools including Malden High School, Cheverus Catholic School, and Malden Catholic.
Ownership History
Date
Name
Owned For
Owner Type
Purchase Details
Closed on
Oct 20, 2023
Sold by
Chan Fung Y and Weng Wuben
Bought by
Yung Shu W
Current Estimated Value
Purchase Details
Closed on
Nov 5, 2010
Sold by
Dorcelus Jamesf and Dorcelus Marie M
Bought by
Wu Bo Wu and Chen Fung Yee
Home Financials for this Owner
Home Financials are based on the most recent Mortgage that was taken out on this home.
Original Mortgage
$217,000
Interest Rate
4.41%
Mortgage Type
Purchase Money Mortgage
Purchase Details
Closed on
Dec 19, 1996
Sold by
Dulong Florence and Grande George
Bought by
Dorcelus James F and Dorcelus Marie M
Home Financials for this Owner
Home Financials are based on the most recent Mortgage that was taken out on this home.
Original Mortgage
$127,300
Interest Rate
7.62%
Mortgage Type
Purchase Money Mortgage
Create a Home Valuation Report for This Property
The Home Valuation Report is an in-depth analysis detailing your home's value as well as a comparison with similar homes in the area
Home Values in the Area
Average Home Value in this Area
Purchase History
| Date | Buyer | Sale Price | Title Company |
|---|---|---|---|
| Yung Shu W | -- | None Available | |
| Wu Bo Wu | $310,000 | -- | |
| Wu Bo Wu | $310,000 | -- | |
| Dorcelus James F | $134,000 | -- | |
| Dorcelus James F | $134,000 | -- |
Source: Public Records
Mortgage History
| Date | Status | Borrower | Loan Amount |
|---|---|---|---|
| Previous Owner | Wu Bo Wu | $217,000 | |
| Previous Owner | Dorcelus James F | $127,300 |
Source: Public Records
Tax History Compared to Growth
Tax History
| Year | Tax Paid | Tax Assessment Tax Assessment Total Assessment is a certain percentage of the fair market value that is determined by local assessors to be the total taxable value of land and additions on the property. | Land | Improvement |
|---|---|---|---|---|
| 2025 | $90 | $791,600 | $270,900 | $520,700 |
| 2024 | $8,700 | $744,200 | $255,900 | $488,300 |
| 2023 | $8,412 | $690,100 | $233,300 | $456,800 |
| 2022 | $8,063 | $652,900 | $210,700 | $442,200 |
| 2021 | $7,748 | $630,400 | $188,200 | $442,200 |
| 2020 | $7,513 | $593,900 | $181,800 | $412,100 |
| 2019 | $7,168 | $540,200 | $173,100 | $367,100 |
| 2018 | $6,904 | $490,000 | $143,000 | $347,000 |
| 2017 | $6,636 | $468,300 | $137,400 | $330,900 |
| 2016 | $6,258 | $412,800 | $126,100 | $286,700 |
| 2015 | $5,987 | $380,600 | $120,000 | $260,600 |
| 2014 | $5,564 | $345,600 | $109,100 | $236,500 |
Source: Public Records
Map
Nearby Homes
- 272-274 Cross St Unit 1A
- 272-274 Cross St Unit 3A
- 272-274 Cross St Unit 2B
- 272-274 Cross St Unit 3B
- 272-274 Cross St Unit 2A
- 23 Upham St
- 13-15 Benner Ave
- 58 Almont St Unit 3
- 410 Ferry St
- 45 Richardson St
- 17 Garland Ave
- 30 Franklin St Unit 105
- 23 Pratt St
- 72 Ashland St Unit 307
- 19-21 Wolcott St
- 89 Judson St
- 44 Stevens St
- 15-17 Barrett St
- 37-39 Park St
- 43 Park St
- 62 Upham St Unit 64
- 64 Upham St Unit 2
- 66-68 Upham St
- 58 Upham St
- 58 Upham St Unit 1
- 85 Linwood St
- 56 Upham St
- 79 Linwood St Unit 81
- 57 Upham St
- 72 Upham St
- 72 Upham St Unit 2
- 72 Upham St Unit 1
- 55 Upham St
- 84 Linwood St
- 84 Linwood St Unit 3
- 84 Linwood St Unit 1
- 77 Linwood St
- 77 Linwood St Unit 3
- 77 Linwood St Unit 2
- 67 Upham St