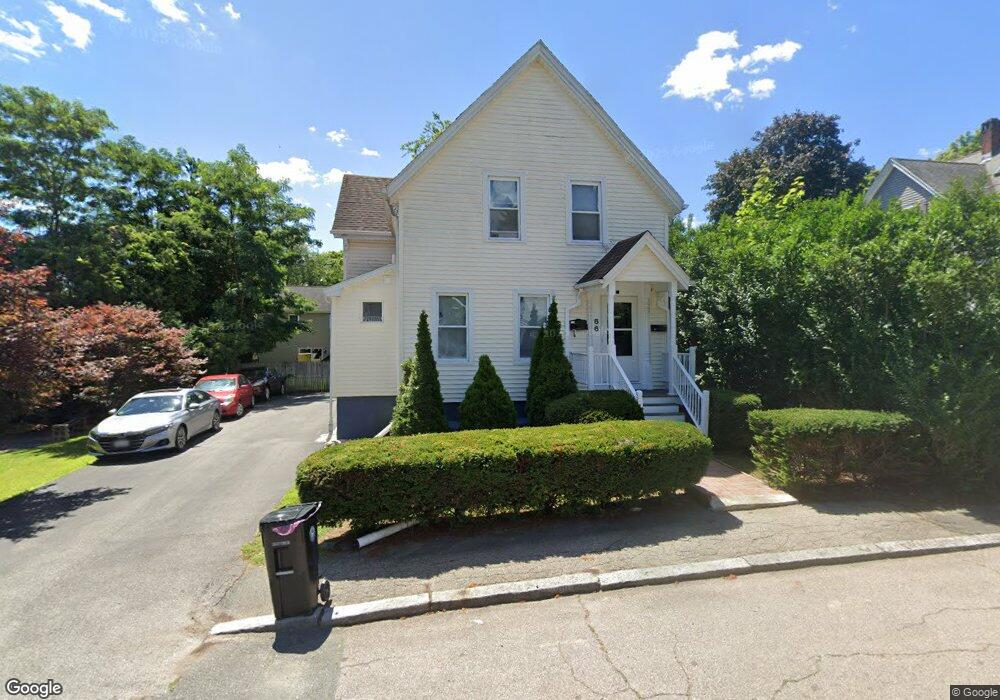
66 Upland Rd Brockton, MA 02301
Estimated Value: $612,606 - $769,000
3
Beds
2
Baths
1,690
Sq Ft
$406/Sq Ft
Est. Value
About This Home
This home is located at 66 Upland Rd, Brockton, MA 02301 and is currently estimated at $686,402, approximately $406 per square foot. 66 Upland Rd is a home located in Plymouth County with nearby schools including Louis F Angelo Elementary School, Raymond K-8 Elementary School, and Hancock Elementary School.
Ownership History
Date
Name
Owned For
Owner Type
Purchase Details
Closed on
Mar 11, 2002
Sold by
Alexiou James
Bought by
Lezama Dolores I
Current Estimated Value
Home Financials for this Owner
Home Financials are based on the most recent Mortgage that was taken out on this home.
Original Mortgage
$195,000
Interest Rate
7.01%
Mortgage Type
Purchase Money Mortgage
Purchase Details
Closed on
Dec 10, 2001
Sold by
Abishala Suzanne Est
Bought by
Alexiou James
Create a Home Valuation Report for This Property
The Home Valuation Report is an in-depth analysis detailing your home's value as well as a comparison with similar homes in the area
Home Values in the Area
Average Home Value in this Area
Purchase History
| Date | Buyer | Sale Price | Title Company |
|---|---|---|---|
| Lezama Dolores I | $195,000 | -- | |
| Alexiou James | $135,000 | -- |
Source: Public Records
Mortgage History
| Date | Status | Borrower | Loan Amount |
|---|---|---|---|
| Open | Alexiou James | $25,000 | |
| Closed | Alexiou James | $20,000 | |
| Open | Alexiou James | $222,000 | |
| Closed | Alexiou James | $195,000 |
Source: Public Records
Tax History Compared to Growth
Tax History
| Year | Tax Paid | Tax Assessment Tax Assessment Total Assessment is a certain percentage of the fair market value that is determined by local assessors to be the total taxable value of land and additions on the property. | Land | Improvement |
|---|---|---|---|---|
| 2025 | $6,984 | $576,700 | $138,200 | $438,500 |
| 2024 | $6,682 | $555,900 | $138,200 | $417,700 |
| 2023 | $5,788 | $445,900 | $103,000 | $342,900 |
| 2022 | $5,860 | $419,500 | $93,500 | $326,000 |
| 2021 | $5,461 | $376,600 | $77,500 | $299,100 |
| 2020 | $4,869 | $321,400 | $72,800 | $248,600 |
| 2019 | $4,684 | $301,400 | $70,800 | $230,600 |
| 2018 | $3,935 | $245,000 | $70,800 | $174,200 |
| 2017 | $3,552 | $220,600 | $70,800 | $149,800 |
| 2016 | $3,521 | $202,800 | $68,500 | $134,300 |
| 2015 | $2,581 | $142,200 | $68,500 | $73,700 |
| 2014 | $2,723 | $150,200 | $68,500 | $81,700 |
Source: Public Records
Map
Nearby Homes