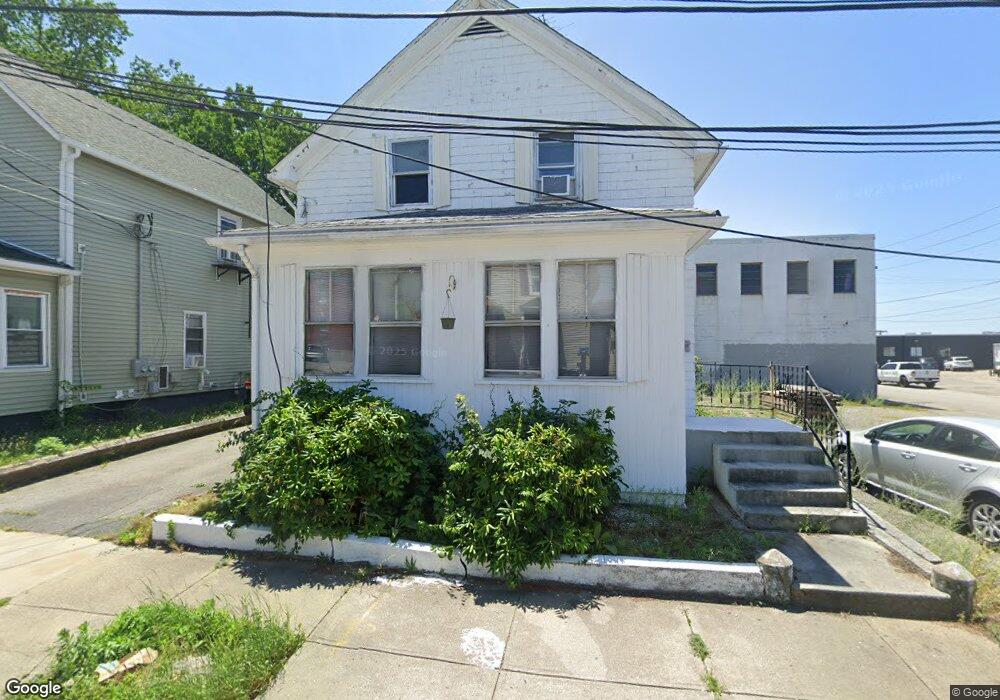
66 Vale St Pawtucket, RI 02860
Woodlawn NeighborhoodEstimated Value: $464,160 - $490,000
4
Beds
3
Baths
1,872
Sq Ft
$257/Sq Ft
Est. Value
About This Home
This home is located at 66 Vale St, Pawtucket, RI 02860 and is currently estimated at $481,290, approximately $257 per square foot. 66 Vale St is a home located in Providence County with nearby schools including International Charter School, Blackstone Valley Prep Junior High School, and Blackstone Academy Charter School.
Ownership History
Date
Name
Owned For
Owner Type
Purchase Details
Closed on
Jul 30, 2004
Sold by
Bora Colette L
Bought by
Amponasah Ama M
Current Estimated Value
Home Financials for this Owner
Home Financials are based on the most recent Mortgage that was taken out on this home.
Original Mortgage
$130,500
Interest Rate
6.33%
Mortgage Type
Purchase Money Mortgage
Create a Home Valuation Report for This Property
The Home Valuation Report is an in-depth analysis detailing your home's value as well as a comparison with similar homes in the area
Home Values in the Area
Average Home Value in this Area
Purchase History
| Date | Buyer | Sale Price | Title Company |
|---|---|---|---|
| Amponasah Ama M | $145,000 | -- |
Source: Public Records
Mortgage History
| Date | Status | Borrower | Loan Amount |
|---|---|---|---|
| Open | Amponasah Ama M | $114,000 | |
| Closed | Amponasah Ama M | $130,500 | |
| Previous Owner | Amponasah Ama M | $100,001 | |
| Previous Owner | Amponasah Ama M | $62,000 |
Source: Public Records
Tax History
| Year | Tax Paid | Tax Assessment Tax Assessment Total Assessment is a certain percentage of the fair market value that is determined by local assessors to be the total taxable value of land and additions on the property. | Land | Improvement |
|---|---|---|---|---|
| 2025 | $4,428 | $336,700 | $104,700 | $232,000 |
| 2024 | $4,155 | $336,700 | $104,700 | $232,000 |
| 2023 | $3,579 | $211,300 | $47,100 | $164,200 |
| 2022 | $3,503 | $211,300 | $47,100 | $164,200 |
| 2021 | $3,503 | $211,300 | $47,100 | $164,200 |
| 2020 | $3,349 | $160,300 | $47,700 | $112,600 |
| 2019 | $3,349 | $160,300 | $47,700 | $112,600 |
| 2018 | $3,227 | $160,300 | $47,700 | $112,600 |
| 2017 | $2,858 | $125,800 | $36,500 | $89,300 |
| 2016 | $2,754 | $125,800 | $36,500 | $89,300 |
| 2015 | $2,754 | $125,800 | $36,500 | $89,300 |
| 2014 | $2,963 | $128,500 | $46,900 | $81,600 |
Source: Public Records
Map
Nearby Homes
- 187 Sisson St
- 41 Campbell Terrace
- 11 Sherman St
- 126 Dunnell Ave
- 159 Dunnell Ave
- 35 Hurley Ave
- 32 Carver St
- 18 Dunnell Ave
- 54 Jefferson Ave
- 76 Slater St
- 80 Hillside Ave
- 107 Mulberry St
- 122 Lowden St
- 193 Harrison St
- 136 Hillside Ave
- 75 Baldwin St
- 116 Toledo Ave
- 18 Fairmont Ave
- 167 George St
- 48 Star St
Your Personal Tour Guide
Ask me questions while you tour the home.