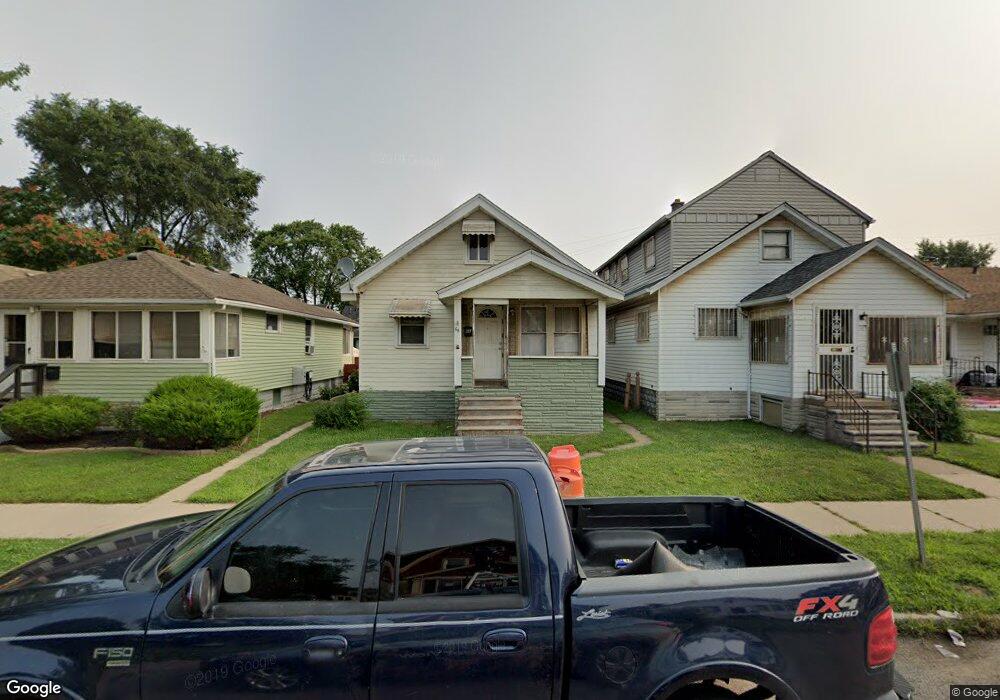
66 W Broadway St Ecorse, MI 48229
Estimated Value: $64,000 - $96,000
2
Beds
1
Bath
880
Sq Ft
$90/Sq Ft
Est. Value
About This Home
This home is located at 66 W Broadway St, Ecorse, MI 48229 and is currently estimated at $79,172, approximately $89 per square foot. 66 W Broadway St is a home located in Wayne County with nearby schools including Ralph J. Bunche Elementary, Grandport Academy, and Ecorse High School.
Ownership History
Date
Name
Owned For
Owner Type
Purchase Details
Closed on
Jun 2, 2014
Sold by
Peter Bluebird Llc
Bought by
Connell Richard O
Current Estimated Value
Purchase Details
Closed on
Nov 7, 2013
Sold by
Wayne County Treasurer
Bought by
Peter Bluebird Llc
Purchase Details
Closed on
Mar 1, 2013
Sold by
Bank Of Solutions Llc
Bought by
Coseth Maximo
Purchase Details
Closed on
Aug 4, 2011
Sold by
Godoy Ligia
Bought by
Bank Of Solutions Llc
Purchase Details
Closed on
Jun 24, 2010
Sold by
Donovan Shaun
Bought by
Godoy Ligia
Purchase Details
Closed on
Sep 23, 2008
Sold by
Chase Home Finance Llc
Bought by
Secretary Of Housing & Urban Development
Purchase Details
Closed on
Sep 11, 2008
Sold by
Elgert Timothy M and Elgert Lisa M
Bought by
Chase Home Finance Llc
Purchase Details
Closed on
Jul 5, 2001
Sold by
Wofford Allen B
Bought by
Elgert Lisa M
Create a Home Valuation Report for This Property
The Home Valuation Report is an in-depth analysis detailing your home's value as well as a comparison with similar homes in the area
Home Values in the Area
Average Home Value in this Area
Purchase History
| Date | Buyer | Sale Price | Title Company |
|---|---|---|---|
| Connell Richard O | $2,500 | None Available | |
| Peter Bluebird Llc | $500 | None Available | |
| Coseth Maximo | -- | None Available | |
| Bank Of Solutions Llc | $2,000 | None Available | |
| Godoy Ligia | $1,800 | None Available | |
| Secretary Of Housing & Urban Development | -- | None Available | |
| Chase Home Finance Llc | $67,121 | None Available | |
| Elgert Lisa M | $63,000 | -- |
Source: Public Records
Tax History Compared to Growth
Tax History
| Year | Tax Paid | Tax Assessment Tax Assessment Total Assessment is a certain percentage of the fair market value that is determined by local assessors to be the total taxable value of land and additions on the property. | Land | Improvement |
|---|---|---|---|---|
| 2025 | $612 | $29,300 | $0 | $0 |
| 2024 | $612 | $28,100 | $0 | $0 |
| 2023 | $583 | $24,200 | $0 | $0 |
| 2022 | $1,126 | $19,500 | $0 | $0 |
| 2021 | $1,154 | $15,100 | $0 | $0 |
| 2019 | $1,118 | $11,100 | $0 | $0 |
| 2018 | $524 | $9,700 | $0 | $0 |
| 2017 | $1,120 | $9,700 | $0 | $0 |
| 2016 | $1,149 | $10,300 | $0 | $0 |
| 2013 | $2,160 | $21,600 | $0 | $0 |
| 2012 | $1,098 | $22,400 | $2,600 | $19,800 |
Source: Public Records
Map
Nearby Homes
- 4067 High St
- 32 W Woodward St
- 46 W Westfield St
- 10 W Broadway St
- 43 W Alexis St
- 28 Salliotte Rd
- 53 W Charlotte St
- 4234 High St
- 19 E Josephine St
- 25 W Charlotte St
- 36 W Charlotte St
- 4241 6th St
- 18 Bonzanno St
- 44 Cherrygrove St
- 54 Elton St
- 50 W Benson St
- 28 Bonzanno St
- 3982 9th St
- 40 W Benson St
- 35 & 39 Knox St
- 68 W Broadway St
- 64 W Broadway St
- 70 W Broadway St
- 62 W Broadway St
- 72 W Broadway St
- 60 W Broadway St
- 61 W Josephine St
- 63 W Josephine St
- 74 W Broadway St
- 58 W Broadway St
- 65 W Josephine St
- 67 W Josephine St
- 76 W Broadway St
- 54 W Broadway St
- 67 W Broadway St
- 71 W Broadway St
- 59 W Josephine St
- 65 W Broadway St
- 69 W Broadway St
- 69 W Josephine St