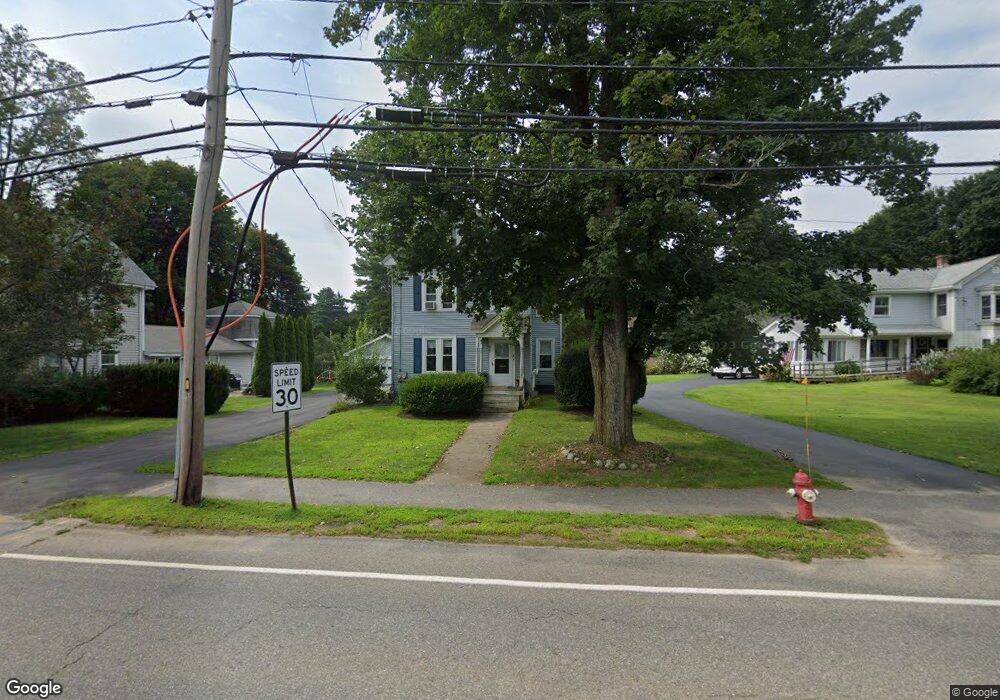
66 W Plain St Wayland, MA 01778
Estimated Value: $846,079 - $1,017,000
2
Beds
2
Baths
1,870
Sq Ft
$509/Sq Ft
Est. Value
About This Home
This home is located at 66 W Plain St, Wayland, MA 01778 and is currently estimated at $952,270, approximately $509 per square foot. 66 W Plain St is a home located in Middlesex County with nearby schools including Wayland High School and Veritas Christian Academy.
Ownership History
Date
Name
Owned For
Owner Type
Purchase Details
Closed on
Jul 10, 2023
Sold by
Larson Adele
Bought by
Adele Larson T and Adele Larson
Current Estimated Value
Purchase Details
Closed on
Apr 10, 2013
Sold by
Larson Myles T
Bought by
Larson Adele
Purchase Details
Closed on
Jul 20, 2012
Sold by
Larson Adele
Bought by
Larson Myles T
Purchase Details
Closed on
Dec 23, 2009
Sold by
Lizotte Robert J and Harmon Joan M
Bought by
Larson Adele
Home Financials for this Owner
Home Financials are based on the most recent Mortgage that was taken out on this home.
Original Mortgage
$292,500
Interest Rate
4.92%
Mortgage Type
Purchase Money Mortgage
Create a Home Valuation Report for This Property
The Home Valuation Report is an in-depth analysis detailing your home's value as well as a comparison with similar homes in the area
Home Values in the Area
Average Home Value in this Area
Purchase History
| Date | Buyer | Sale Price | Title Company |
|---|---|---|---|
| Adele Larson T | -- | None Available | |
| Adele Larson T | -- | None Available | |
| Larson Adele | -- | -- | |
| Larson Adele | -- | -- | |
| Larson Myles T | -- | -- | |
| Larson Myles T | -- | -- | |
| Larson Adele | $390,000 | -- | |
| Larson Adele | $390,000 | -- |
Source: Public Records
Mortgage History
| Date | Status | Borrower | Loan Amount |
|---|---|---|---|
| Previous Owner | Larson Adele | $292,500 |
Source: Public Records
Tax History Compared to Growth
Tax History
| Year | Tax Paid | Tax Assessment Tax Assessment Total Assessment is a certain percentage of the fair market value that is determined by local assessors to be the total taxable value of land and additions on the property. | Land | Improvement |
|---|---|---|---|---|
| 2025 | $10,707 | $685,000 | $362,300 | $322,700 |
| 2024 | $10,131 | $652,800 | $345,000 | $307,800 |
| 2023 | $9,852 | $591,700 | $313,700 | $278,000 |
| 2022 | $10,140 | $552,600 | $259,700 | $292,900 |
| 2021 | $9,682 | $522,800 | $241,500 | $281,300 |
| 2020 | $9,285 | $522,800 | $241,500 | $281,300 |
| 2019 | $8,401 | $459,600 | $230,000 | $229,600 |
| 2018 | $7,910 | $438,700 | $230,000 | $208,700 |
| 2017 | $7,463 | $411,400 | $219,100 | $192,300 |
| 2016 | $6,887 | $397,200 | $214,700 | $182,500 |
| 2015 | $7,082 | $385,100 | $214,700 | $170,400 |
Source: Public Records
Map
Nearby Homes
- 177 Main St
- 37 Pemberton Rd
- 62 E Plain St
- 3 Keith Rd
- 9 French Ave
- 233 Lakeshore Dr
- 15 Parkridge Rd
- 15 Crest Rd
- 123 Dudley Rd
- 108 Dudley Rd
- 26 Dudley Rd
- 96 Lake Shore Dr
- 96 Lakeshore Dr
- 35 Snake Brook Rd
- 22 Lakeshore Dr
- 22 Magnolia Rd
- 454 Old Connecticut Path
- 14 Ferndale Rd
- 18 Magnolia Rd
- 3 Ferndale Rd
- 62 W Plain St
- 62 W Plain St Unit 62B
- 62 W Plain St Unit 62A
- 62 A W Plain St Unit 62A
- 70 W Plain St
- 60 W Plain St
- 68 W Plain St
- 65 W Plain St
- 65 W Plain St Unit 2
- 65 W Plain St Unit 1
- 65 W Plain St Unit 65
- 67 W Plain St
- 61 W Plain St
- 72 W Plain St
- 90 Pemberton Rd
- 73 W Plain St
- 57 W Plain St
- 76 W Plain St
- 11 Pleasant St
- 13 Pleasant St